The thing that benefits the deniers is time, but not as many would think, it is very likely they will not have to deal with the worsening of those conditions as more CO2 is released, but this is like trowing the future generations under the bus.
You need to be a bit careful with Tamino - he is something of a crusader, and rather selective in what he presents and emphasizes. His CO2 hockey stick further down the page isn’t nearly as dramatic if you start the Y-axis at 0ppm so you can see how proportionally large the rise is, for example.
The trendlines he plots for 1974-2010 aren’t raw data - they are the raw data with the influence of the El-Nino/La Nina cycle, the estimated volcano eruptions, and solar insolation variation subtracted. Nothing wrong with doing that, in fact if we could do that perfectly we’d have a better answer for Waldo Pepper! Ten years of flat/declining global temperature data adjusted for all natural variations would be good enough to falsify AGW for me.
Tamino doesn’t show all his working but I can’t fault his approach. He doesn’t mention what value his adjusted warming trend comes out as but eyeballing the graphs gives about .165 deg. per decade - somewhat lower than the 0.18 he used for his artificial data and even lower than the 0.2 used by the IPCC. However, although he’s quite happy to subtract the El-Nino/La Nina cycle from his adjusted line, he doesn’t bother to subtract the AMO. Note that those IPCC graphs are NOT showing global warming - they are showing a long-period oscillation in Atlantic temperatures that is on top of global warming. The North Alantic shows an additional upward swing of about 0.7 deg. over the period 1970 - 2007 - about 0.19 deg. per decade over that time that is purely an energy oscillation and not a warming trend at all! How that affects the average global temperature isn’t too easy to sort out but the Atlantic is a fairly big chunk of the Earth’s surface and you ALSO need to subtract the influence of the AMO to get the true trend. That subtraction would reduce Tamino’s adjusted trend to something notably smaller than the IPCC’s 0.2 deg. /decade. That wouldn’t disprove AGW but it would show that our modelling of its affects aren’t very good.
IIRC, Tamino addresses this somewhere else and basically calculates that the AMO oscillation is insignificant (because the IPCC subtacted a linear AGW trend to isolate the “wavy” AMO and Tamino subtracted a “wavy” AGW trend to leave very little AMO effect.) So far Tamino appears to be alone and against the IPCC in that judgement however.
Well, if Tamino is not your cup of tea (not relying on him alone anyway) I will then go for the independent statisticians to deal with the silly point from Waldo:
And that is essentially why I do not think we will find a significant statistical cooling trend in the last decade, not from CRU, NASA nor the UN.
You can see that over the past decade, the MEI (El Nino/La Nina) has produced a slight warming bias, the solar variation has produced a slight cooling bias, and interestingly to me (and anyone keep their eye on ocean heat content), volcanos haven’t done zip to global temperatures.
Oh, he’s worth reading! I like people who actually dig into source data and numbers. His plotting of Annan’s volcano data as a graph for example was very useful - I haven’t seen that done anywhere else and the source data was just tabulated figures. But I also read his critics, and his critics critics…
I agree there has not been any cooling in the last decade. The case can certainly be made for a sizable reduction in warming rate having occurred however.
When they say anything less than X is “statistically insignificant”, it means that anything more than X is statistically significant. It’s simply not plausible that you have this much trouble in everyday life: that people tell you A is taller than B, and you ask with pure curiosity whether B is shorter than A; that you of course realize C is faster than D, and yet have no idea whether D is slower than C; that E isn’t anything like F but F might well be identical to E.
The act is getting old, GIGO. Find another one.
The point was that they are “the top 3 years”: it’s not the top 6 years, or the top 9 years, precisely because the others aren’t within that statistically insignificant margin of error; instead, the others are – by definition – significantly cooler. You’d obviously be joking if to suggest otherwise.
As to misunderstanding, you’re making a whopper here: I’m saying there’s been no significant warming since '98, which is an entirely different claim than the one you (a) are mistakenly attributing to me, and (b) would, apparently, rather argue against. And since the definition of a “statistically insignificant” threshold simultaneously defines what it is to be statistically significant, the only possible misunderstanding is on your part.
Ah, but I’m not saying it did. Out of curiosity, did it show any statistically significant warming?
What’s conspicuous is twofold: that (a) I don’t claim there’s been statistically significant cooling from 1998-2010, and yet you direct your arguments against that claim; and that (b) you’re eager to call it a charade when the “cooling” side refuses to attach significance values to so-called cooling, but wish to represent the “warming” side by – refusing to attach significance values, of course. A charade indeed.
Unless you’d like to spell out what minimum significant degree of warming needs to play out, on what timetable, to verify your claims going forward – such that anything below said threshold would, hypothetically, falsify it. What amount of warming would be insignificant? You can’t say. What amount of cooling would be significant? You can’t say. How long a plateau would prove you wrong? You can’t say.
Cite? Everything I’ve read has indicated a decline, serious in some places. Here’s my cite, where’s yours? Even if other factors resulted in an increase from the 70’s to the early 2000’s, the rate of polar ice melting has increased greatly since 2000.
It is very simple, stop the tap dancing, can you give us what is the significance rate for the cooling? Or like what you are falling now, the rate that allows you to claim it is not warming? Otherwise you do really have nothing.
As mentioned, who is saying that those others are statistically significantly cooler? Or that it is not warming? (We already know why no honest statistician would use such a short period of 12 years to make the certified whopper that you are still trying to push here) Numbers please, it is your act that is getting old. I already mentioned many times that the game is rigged when you try to keep it in such a small period of time, no honest statistician does that game. And looking at the independent statistician report, the point stands:
You did say:
The whopper here was to say that you got support for that point of cooling from the UN report, that was not accurate, you misunderstood, and now you are compounding that silliness by pretending that there is no problem on misunderstanding what they said, the context was brought home by the interview of the UN climate secretary.
So where are the experts that agree that it is cooling? Cooling or no warming, it does not matter, so far you have only shown that you do not even know who to turn for support.
Out of curiosity, did you ever checked what the independent statisticians reported?
What they found was:
Just like Phil Jones before, there is warming reported, if one underhandedly tries to use the 1998 trick we already know where that leads, to continued denial of the warming trend by continued requests on finding a statistically significant warming in such a short period with no 10 year moving average: no honest statistician would do that.
No, the values of Phil Jones were given as the basis for why it was silly to claim there has been no significant warming since 1995 and so it goes for 1998, the honest answer is that there is warming still taking place, but not at statistically significant levels, but looking at the record years of 2005 and 2010 it is really silly to not realize that the percentage is close to significant again just like in the 1995 case, and a statistically significant warming will very likely happen soon thanks to the pedantic reason that the warming continues and experts do report statistically significant warming on the last 15 years.
I can point at the fact that you had no reason to claim the UN supported you on the cooling point, also that experts do report statistically significant warming on the last 15 years.
As long as there is no support brought by you, there is no good answer to just a pseudo scientific point of yours.
Naturally, since I provide such answers on request sure as you can’t.
As per the WMO report, a change of less than ± 0.09°C or ± 0.16°F is statistically insignificant by dint of being within the margin of uncertainty; a change of more than ± 0.09°C or ± 0.16°F is therefore statistically significant by dint of not being within the margin of uncertainty; no such warming occurred from '98 to '99, but such cooling did. And no such warming occurred from '98 to '00, but such cooling did. And no such warming occurred from '98 to '01, but such cooling did. And no such warming occurred from '98 to '02, but such cooling did. And no such warming occurred from '98 to '03, but such cooling did. And no such warming occurred from '98 to '04, but such cooling did. And no such warming occurred from '98 to '05, and no such warming occurred from '98 to '06, but such cooling did. And no such warming occurred from '98 to '07, but such cooling did. And no such warming occurred from '98 to '08, but such cooling did. And no such warming occurred from '98 to '09, but such cooling did. And no such warming occurred from '98 to '10.
As mentioned, the WMO’s criterion is ± 0.09°C or ± 0.16°F; an amount of global temperature change on one side of that threshold is statistically insignificant, such that an amount of change on the other side is statistically significant – cooler or warmer, as per that “±”.
Just keep mentioning that without going on to say what a large enough period of time would be; it’s music to my ears.
And it’s true: there was cooling after '98 – which is why '99 and '00 and '01 and '02 and '03 and '04 aren’t ranked together with '98 and '05, since they fell outside the ± 0.09°C or ± 0.16°F margin – and there was “precisely no statistically significant warming past that '98 mark during all the fluctuations that followed”, because global temperature never rose past that '98 mark by a +0.09°C or +0.16°F margin.
And it’s likewise still true that it’s irrelevant, since I do only keep mentioning it while asking for a replacement criterion; to make it official: don’t just say what I’ve got isn’t good enough, but rather spell out what would be good enough.
The whopper is that you pretend folks who lay out the upper threshold for “no statistically significant difference between global temperatures” aren’t thereby explaining what happens on the other side of that threshold. The whopper is that you pretend folks requiring a ± 0.09°C or ± 0.16°F margin of uncertainty aren’t thereby requiring the opposite for the opposite.
It says some interesting things about your reading comprehension, though.
Ah, so we now have you on a threshold as well – and if you’ll but switch from implicit to explicit, my role in this debate will perhaps be at an end. Tell me: would using a 10-year moving average be sufficient to falsify it, provided we go long enough without a statistically significant rise? Given, of course, your values of choice for “long enough” and “statistically significant”?
How soon?
(And how much statistically significant cooling would be very unlikely? The amount from '98 to '99? The amount from '98 to '00? The amount – aw, shucks, you know where this is going.)
As long as you have no point, you’re – what’s the phrase? Oh, right: not even wrong.
Hold your horses one cotton picking minute. Let’s get this good and clear here:
Are you , gigobuster, claiming that the UN report does not state clearly and unambiguously that from 1998 to 2005 temperatures declined by an amount greater than the margin of certainty of the measurements technique (0.09°C)?
Simple question. It’s not a leaidng question, so all we require is a yes or no answer.
The Other Waldo Pepper made three related claims:
Cooling occurred from 1998 to 2005
This period of cooling saw temperature variance greater than the margin of certainty of the measurements technique (0.09°C)
Not a single year in the period 1999-2010 was warmer than 2010 at a level greater than the margin of certainty of the measurements technique (0.09°C)
Those are The Other Waldo Pepper’s claims, and he has made them clearly and repeatedly.
Now you claim that:
These claims are not accurate
They are not supported by the UN report he linked to
That he is telling whoppers when he claims that they are supported by the UN report
and
He must have misunderstood the UN report to come to make such claims.
Do you agree with the 4 points immediately above? If not can you tell us which ones you disagree with, and why that disagreement seems to contradict your own statement as quoted above.
“Vice President Al Gore reported Monday that July was the seventh month in a row that was hotter than the previous year, a trend he attributed to global warming. “It would be hard to ignore that something’s going on – and that something is global warming.””
How about a 20 year trend?
“It found that the remaining margin of error in the surface measurements was now probably about one-tenth as large as the observed trend over the last century, and that the surface warming over the 20-year period of the satellite measurements, from 1979 to 1998, was ‘‘undoubtedly real.’’ That warming, it reported, was equal to 2.25 degrees to 3.6 degrees Fahrenheit per century – ‘‘substantially greater’’ than the surface warming over the preceding century as a whole.”
So apparently the global warming alarmists can find statistically significant warming that is "‘‘undoubtedly real’’ in a 20 year or even a 12 month series with no moving 10 year average.
So tell us Gigobuster, how long is sufficient? This is the question we have been asking you for years, and you have never managed to answer.
Your alarmist freinds quoted above found a trend that was "‘‘undoubtedly real’’ over 20 years of data. If we see a cooling trend over 20 years, can we conclude that is "‘‘undoubtedly real’’?
As no honest statistician would do that exercise you did, we will have to dismiss it.
That is not what I was referring to, as the expert reported they could not find a down slope to justify them saying that:
"Statisticians who analyzed the data found a distinct decades-long upward trend in the numbers, but could not find a significant drop in the past 10 years in either data set. The ups and downs during the last decade repeat random variability in data as far back as 1880.
Saying there’s a downward trend since 1998 is not scientifically legitimate, said David Peterson, a retired Duke University statistics professor and one of those analyzing the numbers. "
So the reason why I request values is to find first who is the irresponsible statistician that is giving you misleading information. Then we can see what is the method they are using to justify saying that the warming stopped.
Well. you tell me, I do defer to experts to verify if the positions of a poster have merit, the bigger picture in this discussion is an ongoing defense of a myth, and there is a huge effort afoot by people with other interests that do like to miss what the experts are saying.
Sure, one can answer in the affirmative that there are years that show lower temperature than the records years o 1998, 2005 and 2010 in the last decade, but as Phil Jones can tell you the intention is to ignore that just that answer is a gross simplification that gets one a misleading result. History is clear on this, there is a lot of continuing (as there are no clarifications or retractions from the people making this claims) defense of this myth and so for this and other issues one has to check the sources and their methods so as to check if they have validity.
I told myself I would exit this thread, but I’m going post once more.
Every year since 1998 was cooler than 1998; and this seems to be a major focus for some in this thread.
But (using the URL I gave earlier) every year since 1996 was warmer than 1996. Is there something special about using 1998 instead of 1996? (And every year since 1993 was warmer than 1993; since 1992 warmer than 1992; since 1986 warmer than 1986; since 1985 warmer than 1985; since 1978 warmer than 1978; and since 1976 warmer than 1976.)
I have questions for Waldo. I hope they don’t sound snarky or condescending, because I am perfectly sincere.
Are you interested in a scientific question here, or are you practicing rhetoric?
In the former case, are you interested in the theory of Global Warming? the Theory of noisy signals with unknown components? or in the confusing fact that some probabilistic hypotheses admit no simple falsifiability criteria?
I am interested in a scientific question; specifically, I want to know what hypothetical evidence would falsify the claims in question.
Sure. But just put all your cards on the table as well: are you saying the predictions about global warming involve probabilistic hypotheses that admit no simple falsifiability criteria? Would you add that complex tests of falsifiability can be laid out, possibly building in a specified margin of error to compensate for noise? Or would you instead say they admit no falsifiability criteria, simple or otherwise?
(And, of course, your answer may differ from GIGO’s; I want quick mention of falsification criteria from each person who predicts warming – or cooling, or anything, really.)
Here is a specific (probabilistic) prediction made by the folks at realclimate:
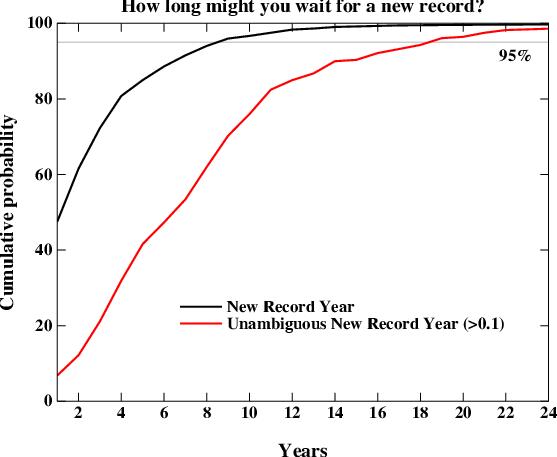
The key chart is here:
According to their calculations, and based on IPCC models, there is a 95% chance of a new temperature record being set within 8 year period and a 95% chance of an unambiguous temperature record being set within an 18 year period.
I think that if we reach these 95% levels without new records, it will be reasonable to conclude – based on that evidence alone – that the global warming hypothesis has been falsified.
Also note that we are overdue for a new temperature record, according to these models.
According to a preferred dataset the 1998 record has already been broken.
At best you could “hope” to falsify some models; concluding that “the global warming hypothesis has been falsified” because some models fail is a stretch. There is much guesswork about temperature variations, as the 1st chart on the page suggests.
Even if a <5% event “falsifies a hypothesis” you will have more than a 5% chance of falsification if you can pick and choose which of several predicted events you use.
Note that this 5% event you call “falsification” will occur about once every 20 records. There have already been several such records within the 95% confidence window.
I don’t really “have a dog in this debate” but feel that in this thread we see deniers seeking refutation rather than seeking honest understanding. And I asked Waldo what I thought was a clear question, but he just repeated the same ambiguous question he’s been asking over and over. (If wants to reread my question and give a different answer, fine. But I’m losing interest.)
Instead of years of record warmth, consider coin tosses that come up heads. Instead of trying to falsify an AGW model, let’s try to falsify the Law of Averages.
The Law of Averages says that there is almost a 97% chance that there will be less than five tails after a heads before the next heads appears, when tossing a fair coin.
If we see five consecutive tails, have we “falsified” the Law of Averages? And since you’ve seized upon 1998 for your claim (a particularly warm year), let’s improve the analogy by not looking for the five consecutive tails until we’ve already seen two!
And I repeat my question: Are you guys sincerely seeking an understanding about statistical methods for poorly understood signals? Or do you have another agenda?