Has the world actually been cooling since 2002?

I agree with that, which makes the original premise of this thread pretty much bunk. I also agree with this statement you made: “You need to establish causation, establish hypotheses, come up with tests for them, make predictions, and in general provide proof that the trend is not mere correlation or an accident of noisy statistics or due to an unknown common cause.”

My point was that this is exactly what’s been done.

And just as a side note, when short-term trends run counter to the long-term ones for some extended period – say around 20 years or so for global climate – there’s usually an identifiable cause other than just statistical chaos that’s worth looking for in the interest of improved scientific understanding. This was identified for the 50’s and 60’s as primarily sulfate aerosols, and was followed by an unprecedented jump in the rate of global warming in the following decades. Today the prevailing hypothesis is an increase in deep-ocean heat uptake, clearly an internal phenomenon that will likewise lead to another spike in warming.

Given this degree of violent agreement, let’s move on to what seems to be the crux of the issue…

What you seem to be saying is that “I agree with the incontrovertible facts about AGW, but there are too many uncertainties about the consequences for us to get too worried about it yet.” By implication, this seems to be saying that the science isn’t being honest, because the statements I quoted elsewhere from the world’s leading national science bodies or the IPCC are fairly definitive on the urgency of carbon mitigation.

The problem can basically be categorized into levels of understanding. The basic science is perhaps best represented by a couple of metrics called “equilibrium climate sensitivity” which is the real-world measure of where incremental atmospheric carbon will take global temperatures, and “transient climate response” which is essentially a measure of how fast it will take us there. These metrics are evaluated not just on current temperature observations but on a large repository of paleoclimate data and on well-validated models. This level of understanding is best exemplified by the IPCC Working Group I reports, which are the most attacked by denialists, and which is rather ironic because this is the most robust level of understanding. I suppose denialist loons feel they need to attack the basic underlying facts rather than argue about their consequences.

The second level of understanding is the consequences in terms of climate destabilization and ecosystem destabilization. This is the level addressed in the Working Group II reports, dealing with impacts, vulnerabilities, and adapation. There is a new WG II report coming out next month, and I would suggest that instead of expressing what Stephen Colbert would call the “truthiness” of gut-feel skepticism, that you at least read the Summary for Policymakers if not the technical summary or the entire report.

The third level of understanding comprises the realistic options for mitigation, and is embodied in the IPCC WG III. But as you correctly surmise, most denialists are still fighting at the level of WG I – the basic scientific understanding – and furiously trying to deny that we have any.
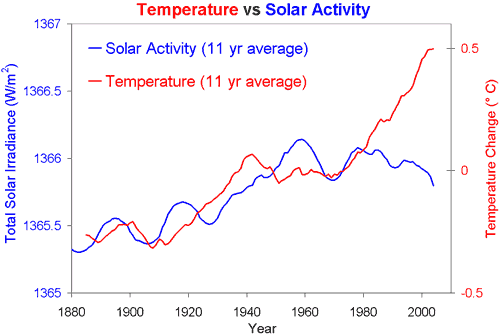
I haven’t seen anyone claim that solar variations don’t exist or “have no effect of any kind on climate”. I have, however, posted the scientific data showing that they have no significant effects in the context of post-industrial climate change and the foreseeable future where the effects of anthropogenic GHGs are overwhelmingly dominant.

Solar output does vary, but predominantly within a narrow band governed by the 11-year sunspot cycles with no overall net change in TSI and no net effect on global average temperature within the kinds of timeframes we’re discussing. It’s long been known that because of significant differences in solar irradiance in different parts of the planet, solar variability can influence regional climates. This is what the paper you cite is discussing, and the cite in the context of your argument is, with all respect, irrelevant and appears to reflect a misunderstanding of what the paper is about.

Hey, come to think of it, it’s cooler today than it was yesterday. So much for the Global Warmings!

Or on the other side… Hey, come to think of it, there’s a big storm somewhere. Global warming!

Then it sounds like you agree the answer to the OP’s question is more or less the following:

***No, the world has not been “cooling” since 2002, not in the sense of stopping or reversing what is generally considered the current CO2-forcing long-term warming trend.

Yes, in recent years some global temperature measurements have shown a decrease. This is well within the natural short-term variation in climate, and can be plausibly accounted for within the scientific model of a CO2-forcing long-term warming trend.***

Anybody else still want to debate that bit?

If not, I too would be happy to move on to more interestingly debatable questions about specific issues of detection, attribution, mitigation and adaptation.

Yeah, except the OP didn’t posit anything like that.

First off, I’ve read all replies, but can’t respond at length right now. I am truly sorry.

In a scientific debate, one thing always triumphs, always. You can call it evidence, I call it the real world, reality. It always comes out on top, and in that sense, nature, or reality, will always win any debate.

This look atDecember and January data from the CRUTEM3 data set shows 33 years of monthly mean temperature anomalies for the NH, land only.

Red is December, green is January, and the trend line is for the yearly values since 2002.

Here is the NH land along with the NH oceans, same data set, same dates.

This is usually the coldest readings of the year for the NH. Unlike the sat data set, the high arctic isn’t represented. However, it still shows something I find revealing. If you compare the NH ocean mean from “now”, as in the last five January temp anomalies in the NH, to the winters of 1981 (0.962) and 198 (0.832), all five recent January temps were lower.

2008 0.188
2009 0.812
2010 0.798
2011 0.191
2012 0.501
compared with
1981 (0.962) and 198 (0.832)

So in fact, thirty years later, we are seeing winter ocean temps that are lower. Land temps are not, of course. However, by looking at the GISS data, you can “see” why this is so.

The Pacific ocean is the obvious reason. Despite the El Ninos, despite all the forcings, any analysis of the NH oceans shows this clearly.

One more comment on the longer trend, if you please. This is still January means

The land mean shows cooling for some areas.

Reality always trumps rhetoric. The land mean, up until the 1998 anomaly year.

From then to now, +.23 Add the oceans in, +.02 C

So we can easily see the ocean mean is pulling the global down.

Back to the 2002-present. Is that the case still? Land only is +.08, add the oceans, it’s - .2 C

Huge huge difference. Cherry picking? Nature doesn’t care how you describe her.

NH cold season, same story. - .09 C ocean land
NH Land only, - .02 C

What about the NH warm season?

It’s in the OP already. Want to guess what effect the oceans has on that? Yep, land only NH warm season is +.2 C

And for the big picture, global annual mean is - .01C, or 0 depending on which analysis you choose.

.
If the ocean, that be the Pacific in this case, is the “cause”, and in 11 or 12 or 13 or 17 years, depending on the data you use, has kept the global mean from rising, even with two large El Ninos, which both raised the global mean, then one could certainly say “the world” hasn’t warmed. In fact, it cooled since 2002.

The objections to this phrasing are quite valid.

The questions about why are valid.

The questions about “can we tell what will happen next?” are really valid, and I appreciate every bodies input. Thank you

Then you ignoring reality, or refusing to look.

That is false, completly false. Which is bad enough, but the pseudo-scientific are much worse.

That display of willful ignorance, perhaps even deception, is appalling to me. It certainly is to all astromomers, who know a lot about this matter. Same for oceanography, which is based on science, not politics or belief.

In this regard, we will certainly see, as at the moment the sun is quiet, while CO2 is still rising.
An almost childish view of the sun is illustrated in this graphic.

Scientists who have spent a lifetime in study and research of these matters are some of the biggest skeptics of the “climate” experts, as they can see how the “science” is agenda driven, not evidence based.

They look at graphs like this
http://oceanworld.tamu.edu/resources/ocng_textbook/chapter05/Images/Fig5-14.htm

As well as longer timelines and climate changes that are not simply temperature change.

But that is another big topic of course.

This of course, is still the entrenched position of many, who refused to even discuss the cooling trend when it became apparent in 2006, and obvious in 2010, and undeniable in 2013.

The GISS page is actually quite useful for showing how the presentation of data is done, to try and sway an audience, cherry picking at it’s finest.

http://www.giss.nasa.gov/research/news/20140121/

Here is why that page is deceptive in the extreme, IMNSHO of course.

Shows trend from 1950, avoiding any recent trends, all of which would show cooling of some portion of the world. Especially the Pacific ocean.

Anomaly graphic is shaded to avoid showing the extreme cold areas, and compares now to the coldest portion of the temperature record for the last 100 years.

An honest look at all the data would explain this, and perhaps show graphics like these, which ironically come from GISS of course.

2013 anomalies

And for a laugh, extreme cherry picking to skew the
2013 anomalies, slanted the other way Haha, that is just awful.

temperature trends, and trends, and trends

It’s easy to see why they don’t want to discuss those views.

No global warming based science source wants to even use the word “cooling” in describing global annual temperatures.

Most don’t even want to talk about the NH boreal winter cooling trends, much less admit the Pacific ocean has trumped everything. And that all the models are flat wrong.

Certainly the claim that “the ocean ate my warming” can be made, and that it is unfair to expect models to get it right, especially when science and nature are in a troubled relationship, and science comes home each night, and always finds nature blowing the neighbor.

Here is a simple graphic of the sunspot cycle, and the NH January temperature, since 1910, all data pretty damn solid.

red is sun, green is January temps,

Noisy version

Clean version

And just for fun

So extensive links to solid data is rhetorically converted to “a fantasy”, an interesting look at perception.

A paper which starts off saying clearly, the conclusion, is viewed as “they didn’t show that”.

Monthly trends, along with annual trends, is viewed as “tracking specific months is not the same as tracking annual average temperatures”, which seems obvious.

Saying " nor … is such a short-term eventuality of any particular relevance" wasn’t the question. It is do you agree that the data shows cooling since 2002? It’s a starting point. Obviously if nobody can agree with a single fact, and discussion of more complicated matters is a waste of time.

The “experts” completely predicted this winter wrong. And not only that, when it turned out to be much colder then expected they quickly changed their tune and blamed cold weather on global warming.
http://www.businessweek.com/articles/2014-02-18/the-official-forecast-of-the-u-dot-s-dot-government-never-saw-this-winter-coming

Let’s say that 1998 was the new 1938. We are going to get 40 years of a downward trend in temperature.

What, exactly, would this mean? I mean, even if we suppose every single thing you’ve posted saying that the climate science is wrong, what, precisely, would develop out of this reality for you?

Should we halt all of the work to move to less polluting forms of power production? Should we stop efforts to scrub the polluting CO2 from the atmosphere that we’ve released? As long as no one enacts a carbon trading scheme or debilitating power consumption taxes, we are already on the right path to either fix CO2 production and lead to a better world (Catastropheism is right scenario) or we gain renewable, pollution-reduced energy production (Catastropheism is wrong scenario).

The earth, even if we are in a pause - or even a 1938-1970 downturn - is still warmer than it was in 1880. And roughly 35-50% of that is human-activity caused, according to the IPCC. If we can alleviate the human caused portion of it or even erase the long term effects of that, we’ll have a better tomorrow in any case.

Yes. They can’t predict worth beans. It’s one of the things that I agree whole-heartedly with Chief Pedant about. It’s also why I think we need a lot of work on climate models before we should consider them accurate, despite historical matching as a sort of means test.

The answer to the OP is yes, due to La Nina periods around 2008 and 2011, as well as a minor one in 2001, right before the start of your chart. So that is the yes/no and the why. Any other questions?

In case you’re wondering, I’ll preemptively answer the following for you:

Has the world been cooling since 2000? No
Has the world been cooling since 2001? Yes
Has the world been cooling since 2002? Yes
Has the world been cooling since 2003? Yes
Has the world been cooling since 2004? Yes
Has the world been cooling since 2005? Yes
Has the world been cooling since 2006? Yes
Has the world been cooling since 2007? Yes
Has the world been cooling since 2008? No
Has the world been cooling since 2009? Yes
Has the world been cooling since 2010? Yes
Has the world been cooling since 2011? No
Has the world been cooling since 2012? No

To save time, I can answer the far more important set of questions rather easily:
Ending today, has the world been cooling since any starting year you care to pick, between 1850 and 2001? No

Can I cherry pick short term periods and show that it cooled in subsequent years? Yes

Numerical modeling is only as good as the algorithms used. As the years go by, these algorithms get better. This a very useful approach to determine which direction our research should lead. However, in and of themselves, they are just statistics, and statistics are never proof. They just don’t explain what exactly is going on, theoretically.

There’s around two dozen factors that effect climate, most all are interdependent, some unpredictable. Numerical modeling can point us in the right direction, but that’s about all.

I think we already answered that. As I summed up the responses to the OP a few posts ago:

I think you missed wolfpup’s point, which was that you somewhat misstated the paper’s actual conclusion (being partly misled by rather loose wording in the abstract which you cited). That is, you made the claim

But the statement you quoted from the paper itself says that

“The annual-mean global temperature has not risen” != “the planet has not warmed”.

Also, IMO you kind of misrepresented the actual focus of the paper by ignoring what the abstract went on to say about its findings:

Well, yeah, it can. That’s what scientists do when an existing hypothesis doesn’t fully account for the observed data: they propose a modification to the hypothesis that does account for it.

Are you actually criticizing the science of current hypotheses about changes in ocean heat uptake, and if so, what specifically do you object to about it?

Weather and climate are not the same thing, and the models are based on fundamentally different baselines. Seasonal forecasts are heavily influenced by individual instances of chaotic behavior in the climate system, whereas in climate models these tend to cancel out over time and the emphasis is on more predictable energy flows. As I said before, I may not have any idea what the weather will be next week, but I know for sure that it’s going to be a lot warmer six months from now. It’s often easier to estimate the average trend of variables over the long term than to account for short-term chaotic variations. It’s not that climate models are perfect by any means, but the analogy you’re trying to make is deeply flawed.

To be clear, I am replying to this amazing post, of which these are just the immediately pertinent snippets.

Completely false? So you quote the American Institute of Physics as an example of how established science is “completely false”, and provide as “proof” the same ridiculous misinterpretation that you posted before and that I already debunked the first time you posted it. And yes, at that time I also mentioned no fewer than five other things you also got completely wrong in the past few days. It’s a pattern, and it continues…

And now we have “willful ignorance”? :rolleyes: That’s a pretty hefty level of arrogance for something that is once again wrong.

Lean and Rind (2008) show that solar variation for the period 1979-2005 was negative at -0.004K/decade verus total anthropogenic of +0.199K/decade.

Lockwood (2008 - Proc. Royal Society) states: It is shown that the contribution of solar variability to the temperature trend since 1987 is small and downward; the best estimate is −1.3% and the 2σ confidence level sets the uncertainty range of −0.7 to −1.9%.

Foster and Rahmstorf (2011) (from the paper I already quoted): When the data are adjusted to remove the estimated impact of known factors on short-term temperature variations (El Nino/southern oscillation, volcanic aerosols and solar variability), the global warming signal becomes even more evident as noise is reduced … The long-term warming trend almost exclusively stems from anthropogenic forcing.

Do you honestly think you have any credibility left on this topic?

Hmm… climate scientists are “scientists who have spent a lifetime in study and research of these matters”. For the record.

What is your point?

Note the graph from 1980 to “present”, which of course ends at some undefined point, with out showing the time period from 2002 to now

Unlike this graph, which shows 1980 - present

The green line is the NH January mean, one of the many things solar scientist knows well.

Here’s the global mean land only for midsummer

here’s the same for mid winter

Why doesn’t skepticalscience show you an up to dat graphic that illustrates what is actually measured?

for 1980 - present?

Does it give the idea there might be some connection between the winter mean and the solar activity?

So many questions, so little time.