Sorry FXMastermind, but you evidently misunderstood again, and are trying to argue against data about one phenomenon by comparing it with data about a different phenomenon.
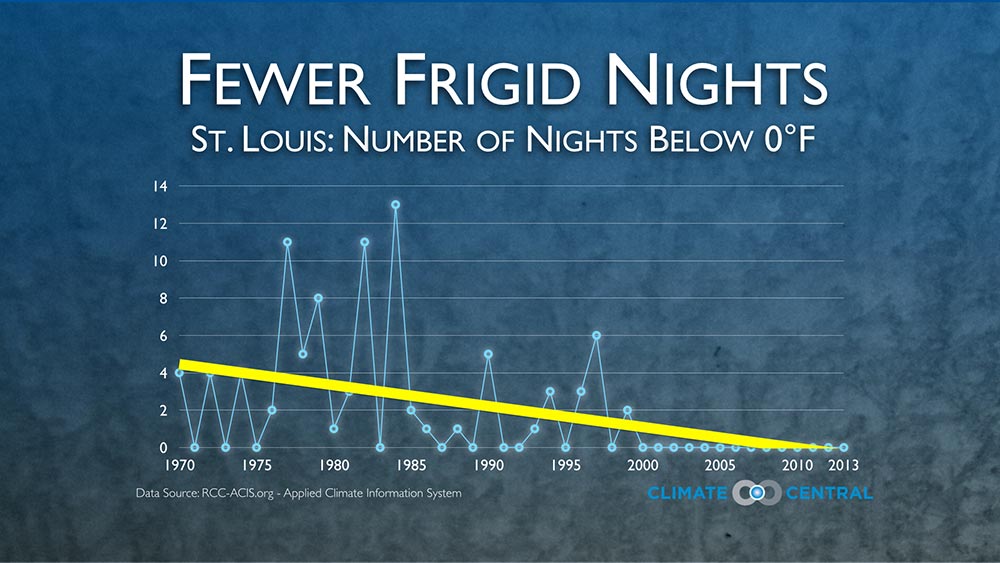
That is, the data the linked xkcd comic is using concerns incidence of subzero (Fahrenheit) minimum daily temperatures in St. Louis. You are trying to argue that it’s wrong by appealing to graphs of average monthly or trimonthly winter temperatures in St. Louis.
But they are not the same thing. Your data do not contradict his data.
The xkcd author was not “fooled”: he was talking about a different climate phenomenon than you are.
Moreover, if you want to examine long-term change in climate phenomena, there is nothing “deceptive” about looking at a longer period instead of a shorter period. If I look at, say, the same data
I don’t deny that alarmists have co-opted the scientific message of climate change for their goals to do with environmentalism as a whole. But I see the same thing everywhere. One kid learns well by staring at dancing crayola markers on tee vee and a whole new “Educational Paradigm” is afoot (conveniently funded by crayola).
There is money grubbing going on all sides of this whole climate change thing. Deniers generally want to pay less to keep doing what they’ve always done. Companies take advantage of the federal government’s loans to produce green technology, and politicians play patty-cake with the entire process to make themselves look good.
I know it’s a sad state of affairs, but you shouldn’t trust a politician, “think” tanks, media reports or anything else on the science. They are using climate change to advance their agendas and for nothing else.
And here is the problem: You say you can look at the data and see, but you are looking at bits of the data. I know a person who got sick on McDonalds french fries. Using him as my data set, i can say that 100% of people who eat french fries from McDonalds get sick. But you may notice that each McDonalds sign says “Billions and Billions served.” I cherry picked my data set.
Yes, we can look at the bit of winters getting colder, but it kinda makes sense: Winters get colder and summers get hotter and the average stands still. There is still change afoot, though. That we don’t understand it is fine, but it was a very, very bad mistake to rest this entire debate in the political sphere on global average temperature. It makes it easy for a politician to understand, but if we are going to rest on temperature at all, we need to rest it regionally (and international regions to boot) to illustrate that there is change, and where the change is occuring.
Further, climate scientists - as exemplified by the climate gate 1 and 2 email sets - themselves debate the starting date for measuring change. They sorta kinda agreed to the date base they have now because it went from “Climate geek” to “mainstream media” and that’s what the MSM latched onto.
So, given all of this, look at the full trend. As far back as you can go, even the Central England Temperature series, which goes back 400 years shows that the earth’s been warming the entire time, which means we are definitely in the middle of a trend of natural warming that accelerated between the 60’s and 2000 (okay, okay, 1998). This acceleration is where everyone is watching. The natural trend? They try and tease out the signal from natural and man-made, but it’s incredibly difficult in a complex and chaotic system.
Even if it turns down, even if we shoot to -1 C below the 70s baseline we use today within a single year, we are still adding to roughly 30-50% of the greenhouse effect we are experiencing.
I understand that it frustrates you that alarmists ignore smaller trends in the pursuit of their political ideology, but they are not trying and probably will never try to embrace the science beyond the easily digestible pieces that reinforce their ideology. The deniers do the same. And it’s all bullshit.
Don’t stay in their camps. To do so will be to embrace defeat and accept that humanity can never rise above a problem of our own making and resolve the issue, except by pure, dumb luck.
Nobody is getting ridiculed and mocked for saying the winter is cold. The winter is cold (at least in the parts of the world where they’re not having an average or warm winter).
What people get ridiculed and mocked for is jumping to conclusions about long-term trends based on recent experiences. And rightly so.
Come summer, when other people start claiming that some random recent heatwave or drought is somehow “proof” of global warming, they’ll deserve to be ridiculed and mocked too.
Indeed, I was investigating and was finding the same thing, FX got it wrong once again, the charts from climate central looked at the days below zero in the city.
FX looked at the state data, (and with no trend line) plenty of other places to get colder readings, but that was not the point made my XKCD.
I think that the evidence found by me and **Kimstu **should show who is looking at the science; true, there are a few alarmists out there, but we should remember that there is a lot of misinformation out there that claims that the scientists or the IPCC are alarmists too when they are pointed by a few groups as being too conservative on this issue, many contrarian or “middle of the road” sources out there also insist that there is an equivalency that does not exist.
I completely agree, but unfortunately for the state of public opinion that perspective requires either a reasonable knowlege of the subject matter or, at least, a rational view of the credibility of the contemporary research. But the egregiously distorted hyping of uncertainties is, in fact, precisely the modus operandi of the practicing denialist. Far easier to spread FUD and exaggerate unknowns than to address the state of knowledge on its merits, especially when there are powerful financial incentives to discredit the science. And if some of the FUD is entirely an outright lie, it’s all good, too. And probably the most unconscionable bottom-feading malfeasance of all is the smearing of accomplished climate scientists – largely by conservative interests – in a sordid effort to discredit their results. The objective, which has been disturbingly successful among the general public, is to establish the denialist camp as, if not more credible than actual science, at least on an equal footing with it. And in the process, to cast the scientists themselves as a band of zealots rather than practitioners of objective scientific inquiry.
I would ask those of a “skeptical” inclination if they disagree with anything I stated here.
And once again, a bunch of links which are supposed to imbue some kind of science-y aura, but which add absolutely nothing to the discussion.
I don’t know if you welcome learning something new or not, I can only comment on what you post. And what you post is, with all respect, pretty consistently at odds with the science, sometimes outrageously so. And often stated in imperious terms of absolute certainty. Examples abound and I’ve been pointing them out for some time now, you just don’t seem to acknowledge them.
Over here, for example, you said “In the spirit of dispelling ignorance, not spreading it, let me show you why the claim “water vapor is a feedback loop, not a driver” is a made up and false statement.” And over here, you doubled down on it: “The problem is, when people make things up, like “Water vapor is a feedback and not a forcing”, there isn’t any evidence that such a statement exists, except where somebody made it up. You won’t find it in a textbook, or any scientific paper, or even on a real climate science page.”
As I pointed out in several places, with cites here and here, the nature of forcings and feedbacks (and the difference between them) is one of the first things one learns in Climate Science 101, and water vapor feedback is one of the most fundamental principles in atmospheric physics. So one is left wondering what point you were trying to leave the reader with, and why, since any possible interpretation of those statements is scientifically backwards and profoundly wrong.
If you really want to learn something, may I suggest an introductory text on the subject, like the one I quoted in the last link.
And not to belabor a point, but I already mentioned half a dozen other things you got wrong, and the baseless rant against climate models, and the specious subject of this entire thread, and the semantic shell game you play with the subject of solar variations, constantly changing the context and the timescale of the discussion – a discussion in which context and timescale is critically relevant to the conclusion. And of course, attributing to the AGW argument absolutes that no one has ever claimed.
It’s not “my data”, data is not owned, nor different depending on who “has it”. That is one of the problems with this ridiculous argument.
I know what he said, it’s not confusing. If I could link you to “his” data, which doesn’t have a source, we wouldn’t be doing this dance.
It’s deceptive not to present all of it, and to cherry pick to show only warming. That is a serious problem. Seriously. It’s so common most people don’t even realize it happens. For example
That is exactly the kind of cherry picking that is done all the time.
That is why what you did was cherry piking, looking for specific good data from groups that conclude one thing to claim the opposite of what they report when they check the big picture.
Nope, even recently you were caught trying to point at a small region of the north Atlantic as cooling when virtually all the rest of the earth has warmed. Insisting on looking only at the small area to conclude that that was “all of it” and that then we could dismiss the rest was cherry picking.
Remember that as much as the Kochs fund denialism to enhance their fuel interests and lobby for a complete deregulation of everything green, environmentalists lobby for government interference legislation disguised as “save the earf from global warming!”
There are two sides, both with their interests, that are perverting the science for their own ends. Start auditing pro-climate change press and other things and you’ll see as many factual errors and exaggerations as you see in the frothing denier whackjob camps. Yes, you can find sites that are good references for the science, but those aren’t what the average person sees when they flick on the news at the end of the day. By default, the media caters to those on each side that scream the loudest so they can improve ratings.
The problem with this position (besides once again going for a golden middle) is that it ignores that we should check who is more on the money any how, if in the past there were civil rights people that were very annoying and considered extreme (when they were in reality middle of the road as history showed), there were other groups against them that continued to push for discrimination; and we know that, what we need to investigate is who is more correct anyhow.
Oh dear, reading comprehension again. I was not claiming that either the xkcd author or you personally owned any of the climate data in question. Allow me to rephrase:
The data referenced in the xkcd comic about incidence of subzero (Fahrenheit) daily minimum temperatures are not in any way contradicted or refuted by the data you linked to about average monthly and trimonthly minimum temperatures.
Well, you evidently didn’t understand it. Or else you would not have tried to rebut it using an inappropriate data comparison.
:dubious: So you’re saying that in discussing a long-term climate trend, what you consider “deceptive cherry-picking” is showing a long-term dataset? Chopping off the early part of the dataset to show only recent years is more fair and more representative, according to you, than showing data over a longer timebase?
This is relevant to the idea of dumping as much CO[sub]2[/sub] into the atmosphere as we possibly can … to warm the Earth … as something that would be good for humans … allowing them to thrive better.
First we have to establish how the climate changes due to natural causes, then we can subtract this amount from the total climate change so we can know what part man-kind has caused.
Is only 100 ppm CO[sub]2[/sub] attributable to man-kind, and the other 300 ppm natural?
Earth Day is April 22nd … let’s work together to heighten awareness by boycotting Big Oil that day !!!
And as usual, climate central is wrong. I don’t know if it’s deceptive or ignorance, but that idiot chart they use is wrong.
Of course I can prove it. Anyone else can as well, you just have to check the records for either St Louis or the state.
That’s why I am so scornful of deceptive “data”, like the climate central shit chart.
They show no below zero days since 2000. If I show you even one day below zero, they are wrong. of course there is far more than one, but the point is simple, they are wrong.
The trend in St Louis for January since 2002 is -3.5 F a decade.
Which is why they don’t show a trend map, but used some ridiculous “days below O F”.
Like if that was not done before, so more ignorance; to begin with, after the arrival of early humans and before humans began to change things carbon dioxide concentration was stable at 288 ppm.
No, that is not evidence just tap dancing, they (and XKCD) referred to days below zero in the city, you are still pointing at whole state monthly data. (You are ignoring the heat island effect that cities have indeed)
If we’re considering what climate conditions would be best for humans, then the only relevant part of the Earth’s history is the part in which humans have actually existed, or about the last couple million years of the planet’s approximately five-billion-year history.
And as for humans thriving, the human species seems to have been most successful and made the greatest progress in securing its survival within the past several thousand years, when CO2 levels were significantly lower than they are now.
So why should we assume that “dumping as much CO[sub]2[/sub] into the atmosphere as we possibly can” is a good thing for humans?
Like the xkcd comic, and the “data” it was based on, and the logic he used, a lot of people try to “spin” data like a pundit uses rhetoric to sway an audience. Science doesn’t do that. You don’t pick and choose and deceive to “show” something that you want people to believe.
That is anti-science, or pseudo-science. It’s become endemic in climate science. Evidence is of course, easy to display.
I know climate central, or rather their source, is wrong, because the data clearly shows this. With data it’s easy, you see the data, you know what is there.
What xkcd and climate central are tap dancing around, trying to get you to not look at, is all the facts. St Louis, why that city? Why use “below zero F” as a metric? What was the complaint they are trying to handwave away?
See? They used “days below zero in the city”, to try and tell everyone suffering record cold, that they just think it’s colder, and that it used to be normal, this sort of cold. It’s lies, it’s deceptive, and it’s even wrong, based on the evidence, the data.
I know this because I simply checked. Anyone else who checks will also know this. That’s how science works. You NEVER HAVE TO TAKE MY WORD FOR IT, that is why science is awesome, and just typing stuff out is useless.
What is so easy in this case, is that St Louis is really easy to check, to see every day, every record, and it takes two mouse clicks. Or three if you are skeptical.
Anyone in the world who looks at the climate central “data” can check to see if it’s fake or not.
It is, no doubt about it. Zero doubt at all. Fake, and if you are too lazy to check, I will bet you any amount of money.
You will lose as you are wrong (and anyone can check that you are using the state average temperature and not the number of extreme cold days in the city), as you were by trying to compare the sun spot charts with the ones about sun irradiance, claiming that CO2 was not warming the planet, and much much more.