The flaw in this interpretation is in drawing conclusions about long term climate change over a relatively short period of time. Only over a period of decades can you confidently discern climate trends. Otherwise, you run the danger of mistaking weather for climate.
Nevertheless, several important questions remain - what’s caused the warming of global surface temperatures to slow in the short-term?
Solar Minimum
The general consensus among skeptic blogs is that diminished solar activity is the cause. The sun is currently at solar minimum - cycle 23 just ended and cycle 24 is having trouble kicking along. It’s as cool as it gets in the solar cycle.
However, a temperature drop of 0.6°C would require a dramatic reduction in Total Solar Irradiance (TSI). According to theoretical calculations at Atmoz, TSI would need to fall to 1347.65 W/m2 to produce a global cooling of 0.6°C. In other words, 13 W/m2 less than current levels. This is ludicrously large considering the solar cycle varies only around 1.3 W/m2.
Alternatively, Camp 2007 adopts an empirical approach to calculate solar influence on global temperature. He determines the solar cycle contributes 0.18°C cooling to global temperatures as the sun moves from maximum to minimum. Employing back of a napkin calculations, TSI would need to fall roughly 4.3 W/m2 to provide 0.6°C of cooling.
Either way, TSI needs to drop considerably to be considered the driver of 2007 cooling. So what has the sun been doing over the last few years?
Figure 1: TSI Composite and Sunspot Numbers (graph courtesy Greg Kopp).
Satellite measurements show no dramatic drop in TSI over the past several years. Instead, the solar cycle is following its usual 11 year cycle, flattening out as it reaches solar minimum. So if not the sun, what’s causing the cooling?
La Niña
Currently, the Pacific Ocean is in a La Niña phase. During La Niña, cold waters upwell to cool large areas of the equatorial Pacific Ocean. This has the effect of cooling the atmosphere. During the La Niña episode of 1999, global temperatures dropped around 0.5°C.
The Southern Oscillation Index (SOI) is a measure of La Niña. Positive SOI corresponds to a La Niña phase. In 2006, the Pacific Ocean was in El Niño phase (negative SOI). However, in late 2006, El Niño subsided and in mid 2007, crossed into La Niña phase. La Niña peaked around January 2008 and is the strongest La Niña since 1999. In the Eastern Pacific, sea-surface temperatures are about two degrees colder than normal over an area the size of the United States.
Figure 2: Southern Oscillation Index (graph courtesy bom.giv.au).
In fact there was a preponderance of El Niño events in the 1990s and a preponderance of La Niña events since 2000. If we just look at the surface warming trend for El Niño years, for La Niña years, and for neutral years, in each case the trend is very consistent (Figure 3).
ENSO temps
Figure 3: NOAA annual global surface temperatures from 1968 through 2012 with La Niña years in blue, El Niño years in red, ENSO neutral years in black, and volcanic years as orange triangles. Linear trends for 1968–2012 for each of the three categories (excluding volcanic years) are shown in the final frame.
Signal vs. Noise
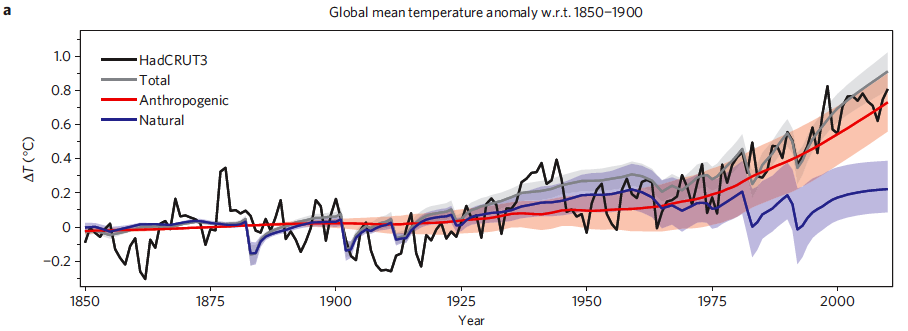
Ultimately arguments that global warming has magically stopped are based on a failure to differentiate between short-term noise and long-term global warming signal (Figure 4).