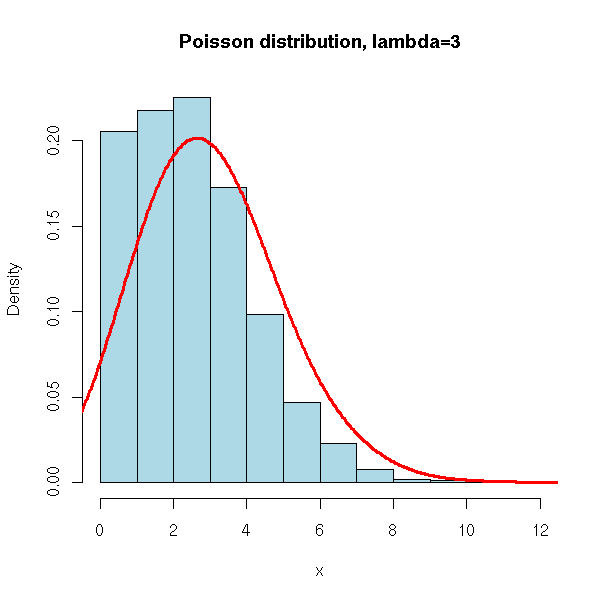
I can’t directly answer your question - but it is not a bell curve (normal distribution) it’s a Poisson distribution.
There can be no universal answer to this question. What you are sort of asking about is “What is my best estimate of the probability if my very next attempt is a success?” and that would be roughly 1/1000. But you don’t know whether – in a perfectly normal scenario for the pocket-searching project – you should expect to have to look at another 10,000 or 1,000,000,000 pockets. There’s no reason to expect the next one to be a success.
Another way of saying this:
Consider the following scenario. “I am attempting to do <task A> and I haven’t yet been successful after 1000 attempts. What is my best estimate of the probability of success for <task A>?”
If <task A> is “Watch cars go by until I spot a yellow Geo Prism with a broken head light,” the true probability is probably like 1 in a billion (say). If <task A> is “Watch cars go by until I spot a 2003 Ford pickup,” the true probability is probably like 1 in a thousand. If I’m an alien who knows nothing about vehicles, I won’t be able to guess the true probabilities, so all I know is that I’ve tried <task A> 1000 times with no success. If I estimate the probability to be around 1/1000, I’ve got a terribly wrong estimate for the Geo Prism task, although it wouldn’t be so bad for the Ford task. (But, I intentionally included a 1-in-a-thousand example. The true probability could be something else entirely for some other task.)
At the heart of all this is that the following two questions are very different:
(1) If I know what the probability is, how many misses would I expect to see in a row?
(2) If I know how many misses I’ve seen in a row, what do I expect the probability to be?
The first one is answerable directly. The second one is not if you don’t want to inject prior knowledge of the probability.
Going back to the “2.3/N” upper limit: This limit is possible because it’s based on question (1). If I assume the probability is 2.3/1000, it is sufficiently unlikely to see 1000 misses in a row that that’s where the 90% confidence level upper limit lands. But for question (2), seeing 1000 misses is perfectly compatible with probability 1/10[sup]3[/sup], 1/10[sup]6[/sup], or 1/10[sup]99[/sup], and there’s no way to give a best guess. All you can say is that the probability is likely smaller than 2.3/1000.
But in my case, I’m asking what is the most likely probability where 1000 failures followed by 1 success is the most common outcome. The best odds are 2.3/1000, and the worst odds are 1/infinity, but there should be a probability of 1/X where 1000 falures and then 1 success is the most common outcome. It’s not an unusual outcome–it’s the outcome which happens most often.
If the odds are 1/2 (coin flip), then 1 success after 1000 failures is very unlucky. If the odds are 1/10[sup]7[/sup] (lottery), then 1 success after 1000 failures is very lucky. But at what probability is 1 success after 1000 failures the most common outcome? It seems like that probability would be the best realistic probability of that situation.
Basically, I’m saying that if you have a single trial with 1000 successive failures followed by a single success, what is your best guess of the probability of a system which would be most likely to produce that outcome.
This is answerable, and an estimate for the probability is simply 1/1001.(*) That is, it is typical for a process with probability 1/1001 to go 1000 failures and then have a success.
But, I worry that what you are asking here isn’t what you think you are asking, based on the context and questions in the OP. The above question is not related to:
or to:
For those, the answer is “unanswerable”. If the probability is 1/1001, then your scenario of 1000 failures followed by 1 success could be expected. But you don’t know the probability, and you don’t know that you’re about to get a success. You just have 1000 failures. So, the condition “If the probability is 1/1001” doesn’t apply, and thus neither do any of the conclusions from it.
Taking the incorrect inference as correct, you might be tempted to fill in the blanks in the OP as follows: “Since I’ve had 1000 failures, I should expect to try an additional 1000 times before expecting to have a success.” But in reality, you have no such expectation of when that success will come based only on seeing 1000 failures. Doing the same with the other quoted question from the OP, you might be tempted to say “I only have failures so far – 1000 of them – so I should expect to try 1000 (or some other number) more,” which isn’t a correct inference. If you are trying to find that rare one-eyed Geo Prism, you may need a billion more tries, and having seen 1000 failures doesn’t give you any insight into this expected number of failures before success.
Your OP did have a closing line that was different from the rest:
You can say that, after 1000 failures, another 1000 failures is likely. But that doesn’t imply that that’s the expected number of failures before success (which is what your other wordings are asking).
(*) Technical note for those interested: this is a biased estimator, although it satisfies the maximum likelihood conditions. The best unbiased estimator requires at least two successes. This process is governed by the negative binomial distribution.
I had a project at work that was similar to this. We were testing something and looking for failures, which should be rare. After testing 100 without failure, what could I say about the probability of failure? I treated it as a binomial problem:
p = probability of failure
probability of 100 failures = (1-p)^100
Then I worked backwards to find some limits for p.
So the upper limit would be setting that to 0.95, or there was a 95% chance that I should detect a non-failure, but was unlucky and didn’t.
The lower limit would be setting it to 0.05, or there was only a 5% chance of detecting a non-failure, and as expected I didn’t.
The middle would be setting it equal to 0.5, or there was a 50-50 chance I would detect a non-failure and I didn’t.
So in the general case of:
p = probability of failure for one instance
n = number of tries
P = probability of all failures = (1-p)^n
The numbers above are 1-P, the probability of finding at least one non-failure, so
solving for p gives 1-(1-P)^(1/n)
So the range of probabilities after 100 failures is:
Upper: 1-(1-0.95)^(1/100) = 0.0295
Middle: 1-(1-0.05)^(1/100) = 0.0069
Lower: 1-(1-0.05)^(1/100) = 0.0005
The upper limit is similar to what was said above about not being able to say much more than it is less than 0.0295, with 95% confidence. The middle and lower are just making a stab at giving some bound and best guess based on the limited data available.
From there, you can see what happens if you double the sample and what your chances of finding a non-failure are. I leave the math to the reader.
I screwed up that last post, but I don’t feel like writing it all over again. I switched between failures and non-failures somewhere in the middle. Sorry about that. The idea should be somewhat clear though.
If someone is interested and still confused, I could try to explain better.