Does the vintage of the original message have anything to do with this information that it contains?
Unemployment rates vary with time, so I’ll go with “yes”.
People asking about the job market in San Francisco might be a little surprised to hear about the Gold Rush.
They also vary with location. People in Rhode Island, Illinois and Nevada might be more interested than people in the Bay Area. There 50 states after all and not everybody lives in California. Or wants to.
You have remind people online of that sometimes….
I am not sure this generalization is firm enough to make the point- the ratios are all over the place. See link:
Map: Ratio of Taxes Paid to Benefits Received by State
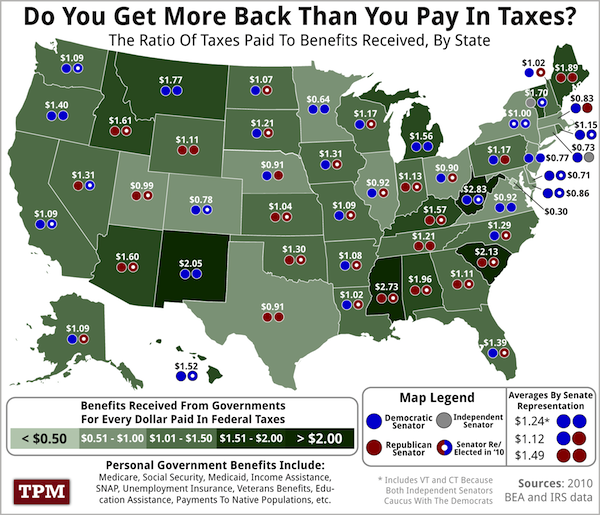
Note that although WY enjoys a favorable ratio of 1.77, ND is only at 1.07, KA 1.04 NE 0.91 and MN (5th highest state in agricultural income) 0.64. Compare to PA 1.17, CA 1.04, and NY 1.00
Also consider that WV, with the highest ratio at 2.83 and less people than KA, is the only state with a population below its historical maximum. Neither it nor MS, SC and NM, the three other states with ratios over 2.00, are in the top half of states ranked by agricultural income.
Thar’s gold in them there apps, Gold I tell ya!
That map only counts transfer payments to individuals, so things like my AF base example aren’t included. The complete figures tell a different story.
Your figures are more complete, but the ratios are still all over the place, and they do not make the case for smaller states all being huge net beneficiaries of federal spending versus federal taxes paid, especially considering agriculture. Presumed farm subsidies leave Minnesota (#5 in agricultural income) with a ratio of .72, Iowa (#3) of 1.10, Nebraska (#4) of 1.10 and Kansas (#7) of 1.12, all still behind WVA-MS-SC-NM and not significantly better than PA at 1.07.
dp
Minnesota is the 21st most populous state. You seem to be ranking them by agricultural income, which is somewhat correlated with population but not particularly.
IANA statistician, but with IA-NE-KA at 3-4-7 in agricultural income the correlation seems remote, especially on a per capita basis.
Here from the 2012 US Statistical Abstract are some details of state-by-state agricultural income, including government payments:
Value of Agricultural Production, Income, and Government Payments: 2008 and 2009
What follows assumes that “Government Payments” refers only to Federal government payments. If state government payments are included, then obviously the significance of the category is for our purposes reduced.
The data would have to be calculated to reflect per capita or per cent of state GDP values in order to determine its true significance. Note, though, that although Iowa obtained 767 million from the government NH only got 9 million. That rules out agricultural subsidy as a factor in NH’s low unemployment. And even in Iowa’s case government payments amount to less than 1% of the state’s >100 billion GDP. On a per capita basis ND appears to be getting the best of it at 600 per capita in government payments, which strikes me as a modest amount.
Off topic something that jumps out from the Abstract numbers is that California is really getting screwed: It has by far the highest agricultural income, in 2004 about as much as #2 Texas and #3 Iowa combined, but it is getting less than half the government payments TX is getting, and is also getting less than Iowa.
Because people in Dickinson ND aren’t as dependent on you as the foreigners–they can find another job without having to worry about their H1B visa’s being revoked.
Huh? While I think there probably are occasionally issues with freedom to work in offshore call centers, it’s usually just locals doing the work so there’s no visa issues.
More generally, though, there definitely is such a thing as “onshoring” which is basically what BlinkingDuck was thinking where companies from big cities outsource busywork to rural areas where labor is cheaper. But usually they don’t set up in some random farm town because grabbing a bunch of former farm hands and cramming them into an office doesn’t really yield good results. The more usual setting is a small rural or semi-rural college town where you have a lot of educated people who want to live there for the college town lifestyle, but there’s virtually no job market for educated people beyond the college itself. So you’ve got a large pool of educated people with an aptitude for office work who are willing to work for very cheap.
I was thinking of importing labor from China and India by H1-B. The issue there is that the worker is trapped by the employer in a situation where they basically can’t quit to go work for another employer, similar to some collective bargaining agreements where the union worker can’t quit one union shop to go work for another.
Yes, it does. That’s why I am questioning why you are using it. ![]()
I thought you meant the correlation was with larger population. No agricultural rankings had been posted except MN’s, and CA and TX are 1-2 in both population and agricultural income.
I mean levels of federal subsidy are correlated with population size, yes. You are using agricultural subsidies as a shorthand for federal spending, which is a small portion of the picture.
A couple years ago, I saw a news story about a call center in the Dakotas (can’t remember where) that was in a town with high unemployment, and they had to go offshore because they couldn’t get people to work there. :eek: How horrible a place must this have been, if you think about it?
No I am not. I am trying to pin down the state-by-state dollar amount of federal agricultural subsidies, and those might be located in the link provided in reply #31.
The thesis of the significance of specifically federal agricultural subsidies originated with you, so I have actually been doing the work you should have done before you posted it. As it is, the numbers I have cited and deduced cast your thesis in a dubious light.
The mention of farm subsidies isn’t really relevant to my point. It was just an illustration. My thesis is merely that low-population states are net “takers”.