Their life and their suffering. Lots of dying people choose hospice care for non-financial reasons.
I’m surprised that the man with the $2 million annual bill to treat his Crohn’s disease isn’t on disability.
Anyway, in the 1980s in Iowa anyway, they were really pushing what was basically a beta-tested HMO called Share. Doctors who signed up for it, usually without an option if they were in a group practice, were paid $27 a month, per patient, no matter how many times they saw them, and good luck getting them to pay for anything other than the most basic care. When I started a new job, the head of HR had nothing good to say about it, and someone in the room had the gumption to ask, “So, why do you have this plan?” He obviously had heard this before, and he replied, “Primary care doctor visits are free, and I have two preschool-aged children.”
Before starting that new job, I actually worked briefly for Share, through a temp agency. It was one of the weirdest onboarding experiences I’ve ever had; the woman who was supposed to train me had worked at Target with me a few years earlier and didn’t remember me, although that in itself wasn’t so strange, because a lot of people passed through there. But if I asked her questions, she would just stare at me with her slack-jaws mouth open, and one time, I swear I saw her start to drool! Weird. I sure didn’t remember her acting that way before.
After the drooling incident, I called up the temp agency and asked to be reassigned, and I was.
My rough calculations for the NHS in England (the devolved governments in Scotland, Wales and Northern Ireland are separate for this purpose), based on published expenditure reports and budget plans, are that about 23-24% of total government expenditure in the current financial year goes to the NHS, but for the purposes of argument (and bearing in mind that expenditure is slated to increase next FY), let’s say 25%.
So assuming that 25% of what we pay in direct taxes (income tax and, for those in employment, National Insurance) goes to the NHS, an individual in employment will pay towards the NHS:
£24000 (minimum wage): approximately 3% of gross income
£34500 (average household income): approximately 4% of gross income.
£75000< approximately 6% of gross income.
Plus 25% of whatever VAT (mostly at 20% rate) we pay on various goods and services, and a slice of other duties (alcohol, fuel, air departures, and so on).
How does that compare with your insurance premiums plus tax contributions to government expenditure in this area?
If the treatment is successful he’s no longer disabled, right?
That’s a catch-22 - you’re disabled, you get help to get treatment, the treatment is successful then you’re no longer considered disabled, so you lose that help, then because you can’t afford the treatment for your chronic condition you become disabled again, you get help again, the treatment is successful so you’re no longer considered disabled…
Not sure how you define “successful,” but in terms of SSA, if you are working and earning IIRC ~$1500/month (~$2500/month if blind) you are - by definition under their regulations - not disabled.
I believe most private disability insurance defines disability as an inability to perform one’s previous/usual job. But they may have a setoff if you are working any job or getting any other disability benefits.
The exception is if you are a veteran, in which case you can earn as much as possible, apply for and get SSA disability, and still collect your full VA bens. I never understood that rationale, but that is beyond this thread.
According to the study (8-page PDF) referenced in this article, and broken down into income quintiles (lowest to highest income) – all in:
Q1: 33.9%
Q2: 23.2%
Q3: 21.1%
Q4: 19.8%
Q5: 16%
[NB: and this is already a model that constitutes 50-60% of all personal bankruptcies in the US – medical debt]
The article also details how health care utilization compares to health care expense (click link to view graph).
Where I think you’ll see some inequities in our current system – inequities that could be (at least, initially) exacerbated by Universal Health Care.
At least, that is, until a different model of health care financing and delivery yields better outcomes and improved health across the lower income quintiles – something that’s a serious issue, today.
A bit of salient methodology detail from the study.
Note: The payments to finance health care are the sum of out-of-pocket, premium, tax, and other payments. The dollar value of health care received reflects national health expenditures, excluding other non-durable medical products (non-prescription drugs and medical sundries) and other private revenues (philanthropy and income from gift shops, cafeterias, parking lots, educational programs, and investment income for institutions such as hospitals, nursing homes, and home health agencies).
One thing to remember: the cost of US employer-provided health insurance is not sui generis. Just like tariffs, increased cost of goods sold, increasing labor rates, and shoplifting, these are costs passed along by companies to consumers.
IOW: employer-provided health insurance is being paid for by the vast majority of American citizens … already.
Being an off-the-grid Buddhist hermit allows you to avoid that, but for most of us … we’re de facto opted in.
Here’s a good summary of where the US system based on private insurance has placed the US in comparison to other industrialised countries:
Some states have a list of diseases, where if you have that disease, their state’s Medicaid automatically covers you, regardless of income or assets. In many cases, it only covers that disease’s treatment, but people are getting otherwise-unaffordable treatment paid for. The most common disease I know of is Factor VIII hemophilia.
ALS patients are also covered by Medicare as soon as the diagnosis is confirmed.
Anyone remember pre-existing conditions? That was one of the insurance companies’ evil tricks. I heard a lot of stories from people before the ACA was put into place.
I have been lucky to have not had any real problems with health insurance. I remember when it was a matter of getting treated, then sending paperwork to the insurance company. Then it was the doctor filed the insurance. For a while it was an either/or situation, and depending on the doctor they might charge a fee for filing.
Then came PPOs. They presented this to the employees as “we’re doing this to make sure you get the best doctors” but my workplace found that was bogus when they made one of the big suburban hospitals and all the doctors in it out of network. Quite a few people found their doctors were suddenly doctor non grata with the insurance company. Then you had to have your PCP refer you to a specialist rather than being able to just go to the type of doctor you already knew you needed
I did not run into any problems along the way, but I have known several people who did
That attitude is reprehensible, and it’s also all too common.
I do believe the entire profit structure of our medical system encourages over treatment, and that there are costs associated with that over treatment, especially with regards to expensive treatments for minor conditions and I think we need reforms in that arena.
But what I find offensive is the idea of denying or approving healthcare based on the perceived value of the person rather than the cost and benefits of the treatment.
Does anyone remember when Rick Santorum said the quiet part out loud?
I want to be clear I have no reason to think that Dinsdale’s belief that some people are inherently unworthy of healthcare is based in racism.
However, a lot of people do hold those beliefs, which is why I believe that systemic racism is a driving force behind the opposition to universal health care in this country. It’s a belief that “those people” are less healthy than “your people”, and that they are going to consume an excessive amount of healthcare without returning any benefit to society.
An adjacent belief is based in the idea that there’s a limited supply of healthcare resources, and if you give “those people” full access to the healthcare system, “your people” won’t be able to get the care they need. And these beliefs are fueled by the long political game of dividing the citizenry into groups and pitting them against each other.
And this is why we can’t have nice things, like UHC.
Rick Santorum’s attitude is totally reprehensible, because one of his children has Trisomy 18, a genetic disorder that most of the time is fatal before birth. There have been many situation, especially in the past 5 years, where six or even seven figures were spent on treatment that was futile at best and cruel at worst, but it’s not my decision when to say enough is enough.
I think it also has to do with “those people” getting “free stuff” at the expense of taxpayers. Ya know, illegals, welfare queens, druggies, homeless, and anyone who didn’t take care of themselves well enough to not need any healthcare resources.
Or just, as i mentioned above
Depending on how you choose to structure and organise your tax system: but a charge where everyone pays the same sum (aka a poll tax) tends to be unpopular.
Yes.
From the 1990’s until the ACA the ONLY way I could get health insurance for my disabled spouse was to work for a health insurance company. Which is why I worked for the Evil Insurance Empire. It sure as hell wasn’t because I believed in the business model. A non-zero percentage of employees at such companies were in the same spot. Post-ACA that percentage has probably dropped since people would have more options.
Well, that’s pretty much what we have now, modulo some subsidies for the lowest income users of ACA.
Here’s a really horrifying story about a Helena, Montana physician who was defrauding insurance companies while misdiagnosing and possibly outright killing patients. For something like this, I would understand an insurance company being hesitant to pay claims. It’s a long story but one that’s worth reading.
He managed to keep up the ruse, not only because he was bringing so much money into the hospital, but also because he had a cult-like following among some of the staffers, and threatened to sue anyone who disagreed with him.
It’s in fact a double-whammy effect – not only would the rich pay more, but these are the folks already happy with their health care coverage, because they can afford the best insurance and afford all the necessary out-of-pocket expenses associated with it. And since the rich largely control the political process in the US, and most importantly, control the messaging filtering down to the unwashed masses, there you have the sad state of health care funding in the US.
Health care just reflects the quality of life in America in general: everything is exceptionally wonderful if you’re very rich, and exceptionally shitty if you’re not. In both the UK and Canada, universal health care came about as the result of a broad social movement to put lower bounds on that wide disparity.
They are not making record profits. Their profit margins are actually fairly middling:
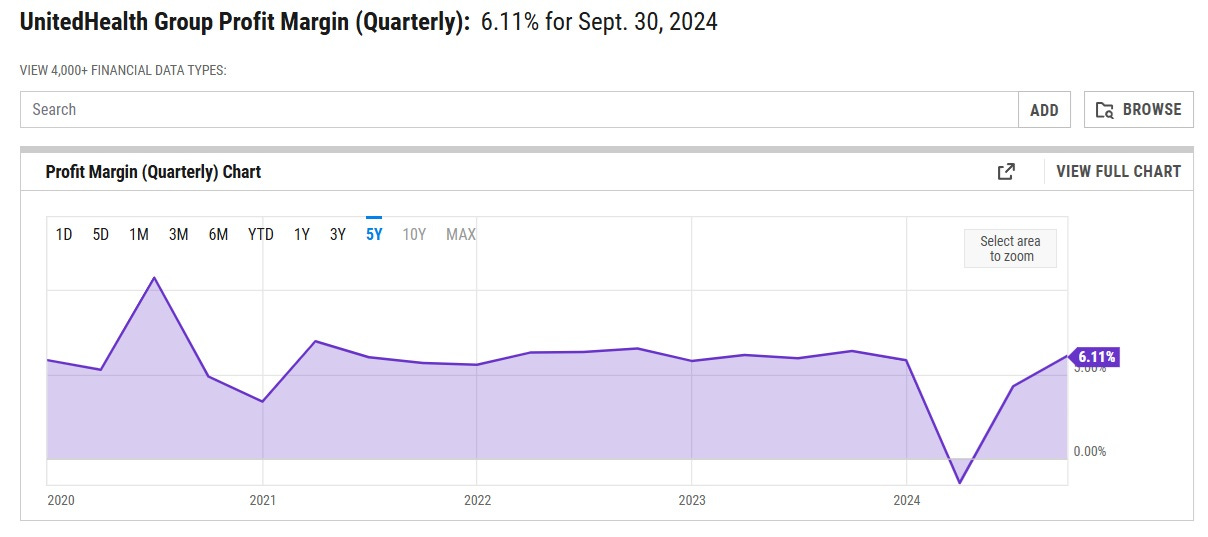
That’s only about half of the average profit margin of companies in the S&P 500. And other big insurers are even less profitable. Elevance Health, the second-biggest, has a margin of between 2% and 4%. Centene’s margin is usually around 1% to 2%. Cigna Group’s margin is usually around 2% to 3%. And so on. These companies are just making very little profit at all.
There are lots of reasons for high healthcare costs. “Record profits” by the insurance companies are not one of them. And executive salaries may very well be unreasonable but they also are just a drop in the bucket.
I think the blog author gets it a bit wrong, though. What the health provider/insurance provider distinction allows is “outsourcing of sin”.
Someone, somewhere has to deny coverage in some cases. No matter how enlightened the system, there are limits. The US system allows the doctors to recommend care outside of what is reasonable or even good for the patient–and then let the insurance company be the “bad guy” when they deny coverage. The caring doctors don’t have to take responsibility for this, just the faceless corporation. The system works great until someone gets murdered.
The health insurance industry uses the notion of “protecting the patient against over-treatment” but my experience is that’s a cover for saving money by denying and delaying paying for anything, and that this “overtreatment” notion is far less prevalent than rumor would have it.
I’m not saying it never happens, just as I wouldn’t claim fraud never happens, but very much the private health insurance companies are a significant part of why health care cost so damn much in this country, and is a significant source of misery and angst for the average person caught in the grinders.