(1) We have a positive for rain if 0.01" or more of liquid water is measured in the rain gauge at the specific location, and we’d have to melt any snow to find this amount. A negative for rain is when our rain gauge remains dry for the time interval.
(2) Some of the best and most accurate weather forecasts come from voodoo witch doctors … [giggle] … yes, that’s being sarcastic … but seriously, let’s not confuse “best source” with any source that’s in anyway “good”. We do the best we can and that’s the best we’ll get. For example, we take our current weather conditions and search our historical data and find the same conditions 138 times. Of those 138 times, it rained within 6 hours on 16 occasions. We would then forecast a 10% chance of rain in the six hours following our current time. Yes, 10% here actually means anywhere from 5% to 14.9%, so-called accurate to one significant digit.
So, as long as we’re clear that “best” source is “not very good either”, then really any are fine. One BIG difference comes in whether the source is commercial or non-commercial. The non-commercial sources tend to be more honest, more willing to say they don’t know and so they’re just guessing. So the National Weather Service or World Meteorological Service. When I lived in Iowa, we had one local station’s weather guy always forecast exactly what the farmers wanted. If it was running dry, he’d forecast rain; if things were too wet, he’d forecast sunny … it was awful. But you know, the guy had products to sell and he sold more if he said things would be great in a couple days, “brought to you by The Johnson City Seed Company, where all news are good news”.
(3) They interpolate (see Wikipedia article). We find the inbetween result by weight-based averaging. So if 2 x 2 = 4 and 3 x 3 = 9, then 2.5 x 2.5 ≈ 6.5. Similarly, if rain is 40% probable in the first six hours, 60% probable in the next 6 hours, we can approximate that it will be 50% someplace inbetween.
≠≠++≠≠
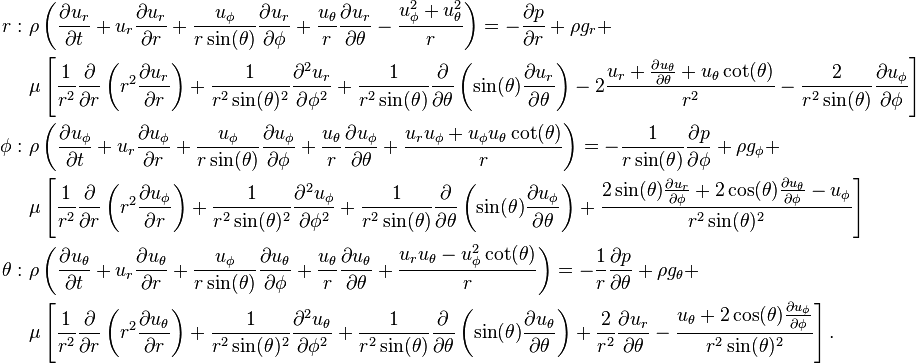
Yes, meteorologists can do the math, here’s the formula caste as partial differential equations, NSFH two-click rule applies (DO NOT let your teenage kid see you looking at this or you WILL be doing a shitload of algebra homework next school year)
Yes, I understand what meteorological models do (in principle, at least). And I realize that forecasts are probabilisitic.
By (2), I meanst a source for the unadulterated forecasts that the models are producing - i.e. what comes out of the NOAA or other models, before being screwed up and misrepresented for popular presentation. The NWS website is the most credible source that I’m aware of, but it doesn’t show very much detail of a probabilistic nature that I can find.
Re (3) - so, ok, then so long as we know the time period for which the probability is actually a probability (rather than just an mathematically invalid manipulation), then at least we know where we stand. Can you direct me to a primary source for NOAA forecasts that shows 6-hour forecast blocks with associated probabilities, if that’s the way the real probabilities are generated in the models?
I have this link from the NHC “NHC Forecast Model Information”. This page also gives links to regular forecast models. Be warned:
“The National Hurricane Center does not generate a graphic of the guidance models it uses to produce its forecasts. Such graphics have the potential to confuse users and to undermine the effectiveness of NHC official tropical cyclone forecasts and warnings.”
Keep in mind that some of these models are copyrighted and leased to the NWS under the conditions the NWS doesn’t publish the detailed results … however I seem to remember a NOAA site that actual allowed the user to download some of the public domain models. I imagine you’ll need a stack of MacMinis to get the flops you’ll need to get a six hour forecast within six hours.
I don’t know what you mean by “a primary source for NOAA forecasts that shows 6-hour forecast blocks with associated probabilities” if none of the links I’ve provided already serve that purpose.
You said that probabilities are manipulated by the news services by interpolation. That’s plausible but obviously quite bizarre, since this is a completely invalid manipulation for the probability of a binary event.
So I’d be interested to know some place where I can see the true mathematically coherent forecast probability distribution that’s generated by the NOAA model for a given location. Perhaps that’s somewhere on the NOAA site that you linked, but I haven’t been able to find it so far.
Where can I see a valid probability distribution for rain in some major city over some time period in the near future? Pick any place and time period that you like, I’d just like to see what a real forecast looks like. Then maybe we can map that to what the hell the news services are doing with that to produce what they feed to the public.
Why do you find this unbelievable from commercial news sources? See below …
First you’ll need to contact the copyright holders and pay the licensing fees. NOAA isn’t allowed to publish this information in accordance with their user agreement. Best you have a couple years upper division Atmospheric Science classes, but you sound smart enough you could learn the trade with a few years apprenticeship and know how to interpret the spaghetti charts. I can’t help you there, I’m the guy who knows the size of header you’ll need over your front door.
I cherry-picked a location where there’s a chance of rain which is Winslow, AZ. Here’s the forecaster’s discussion of these chances.
A commercial news source will flat lie to you if it sells more Ford F-150 4x4’s with the snow plough attachment on the bumper. How do they come up with these probabilities … they lie … simple.
≥≤≥≤≥≤
Again, you seem to not understand probability … We have 138 trials, and 16 are positive … why don’t you understand this is a 10% probability (accurate to one significant digit)?
This is a little ridiculous. I’m not asking for the technical details of how the models work. I’m asking for the form in which the forecast data is published. You said, I think, that probabilities are generated for 6-hour windows, is that correct? Is that what goes from NOAA to the news services, before they screw with it?
It’s a very simple question - do the NOAA forecasts in original form give a rain probability (something that really is a probability) for the binary event of >0.01" rain within a 6-hour window?
This is the NWS forecast that I usually look at. But, again, what the hell do these “probabilities” mean? Probabilities are given for “today” and “tonight”. Are these then 12-hour blocks? Are they using valid methods to derive these from the 6-hour windows that NOAA produces, if that’s what NOAA produces? Or is this the actual form in which the NOAA forecasts are released?
Huh? Of course I understand this.
The issue under discussion is the time periods for which probabilities of binary events are forecast, and the obviously invalid methods that news services are using to convert these to probabilities for shorter or longer time periods.
Perhaps we should start over, which part of The Master’s article on the subject 1) don’t understand and wish to be explained, or 2) would like to be elaborated on?
The statistics here are simplistic, the big computers are needed to search huge databases. If they get 528 hits and it rained 374 times … that’s 70% probability.
Please, I understand The Master’s article in its entirety. Although I am old and grumpy these days, I do have a degree in math and a lapsed commercial pilot’s license. I’m not seeking to be educated in the principles of meteorological modeling and forecasting or how to divide one number into another and express the answer to one significant figure.
I laid out my questions quite clearly in my prior comment. Since you seem to be connected with NOAA, I thought you might know the answer.
Do you understand the problem with obtaining the probability of a binary event for differing time periods, as laid out by the OP and others such as markn+ above?
I’m asking, quite simply:
What form do the probabilistic elements of NOAA forecasts take before they are manipulated by the news services? What is the time period for which the probability of rain is given in a standard NOAA forecast? I gather that I would need to pay a lot of money to see an actual NOAA forecast, but perhaps you have an example of an old one to see the form of an NOAA forecast? I already know how to see the NWS forecasts and aviation forecasts.
Then, what are NWS and the news services doing to obtain probabilities for time periods of different lengths? The NWS forecasts just say a probability for “today” and “tonight”, what exactly does that mean - a 12-hour window? Are the NWS probabilities at least derived by a valid methodology from the NOAA forecasts?
If you don’t know the answer, that’s fine, but please just say so. For Jeebus sake, stop linking to things like the Wiki article on interpolation.
You misunderstand … that page you use IS the official NWS forecast, there is no other product unless you want the teletype version. That’s the only internet site the NWS publishes their forecast. The NWS is the part of NOAA that issues this information … none other.
What the news services do with this data is up to them. If NWS says “highly uncertain”, I suppose the news services makes shit up. And again, NWS is a division of NOAA, such that in all cases NOAA = NWS.
That kind of a link is for the general readership, many who read this may not be familiar with such mathimagical manipulations. NWS runs their models every six hours, and every six hours they issue a “package”. This package include a number of products that the variety of users use in their trade or business. You seem familiar with this package and that’s all there is.
What do the news services do with the data to get the one hour probabilities? I don’t know. It’s certainly not math, and I serious doubt it’s science … and I’m sure every news services does its own way. However it’s made up, it’s not coming from the NWS and should be regarded with caution.
It doesn’t matter. All I did was explain how to mathematically calculate the probability of one event, based on given cumulative probabilities of other events. I did not and will not, venture an opinion on the accuracy of the given odds.
If the first thre batters in an inning are batting .330, .240 and .220, what is the chance they will go three up three down? 1 - (.67 x .76 x .78), or 1 - .397, or .603.
Back in Grad School, my very cool statics professor ( Professor Chen ) explained that statistically over time, the weather changes every fourth day.
The way he explained it, if it is sunny for 3 straight days, statistically the weather will be something other than sunny on the fourth day.
Yes, there were a lot of complex calculations behind forecasting the weather… but… if you followed that very simple rule of thumb you would be right most of the time.
As a rule, I found it so simple that I never forgot it… and the results of its application so close to always acurate that it was almost laughable.
I miss Professor Chen. Great Professor. Great Guy…
Listen to Chronos, he’s knows what he’s talking about. This result requires the assumption of independence. Even then, you’ve actually done it wrong, unless I misunderstand what “three up and three down” means in baseball. The probability is .397, not 0.603.
Hmm, ok, thanks - that is certainly helpful. So I hope we can safely assume that the probabilities that are generated for the NWS format (and obviously the aviation format) are real probabilities derived from the model by people who understand math. I still can’t find any documentation for the forecasts, but I’ll take a proper look tomorrow. In the general NWS format they are given for “today” or “tonight” - presumably that’s likely to mean 12 hour blocks of time, something like 0600-1800 and 1800-0600.
And we have no clue what the hourly “probabilities” given in popular forecasts are even supposed to mean, except that in a qualitative sense they do indicate at what time of day any rain is more likely to occur.
Yes, it certainly does matter. You can’t multiply probabilities for events that are not independent. For example, suppose the probability of a person having blue eyes is 1/10. Then the probability of three randomly selected people all having blue eyes is 1/1000, since they are independent. But the probability of three siblings all having blue eyes is much higher than 1/1000, since the events are not independent.