The electoral vote results on many websites, such as electoral-vote.com, are informative, but don’t provide a handy way to combine all the results in a single number.
Sure, they have things like “Strong Dem”, “Weak dem”, “Tossup”, “Weak Rep”, and “Strong Rep”, and they have different ways of combining them (e.g. report only the sum of the “Strong Dem” and “Strong Rep” states, or or report the sum with every state added in, even the weak support ones), but no single way is provided that takes into account all the results, in a way that more heavily weighs the strong-support states, and less heavily weighs the weak-support states.
So, I came up with a way to do that, and the results are shown below. The end result is a calculation of the probability of a given candidate winning, based on poll results in each state.
First, I present some details and rationale behind the results. You can skip these if you don’t want to wade through details. The results can be found below under the “Results” heading.
Details
For each state, we have
- EV : number of electoral votes
- D : Percent of people voting Democratic, according to latest polls
- R : Percent of people voting Republican, according to latest polls
In each state, whoever has the majority of the votes wins all EV’s. This ignores the couple of states that have a different allocation of EV’s, but they have a small number of EV’s (4 and 5), so for the purposes of this approximation, it should be sufficient to lump them in with the winner-take-all states.
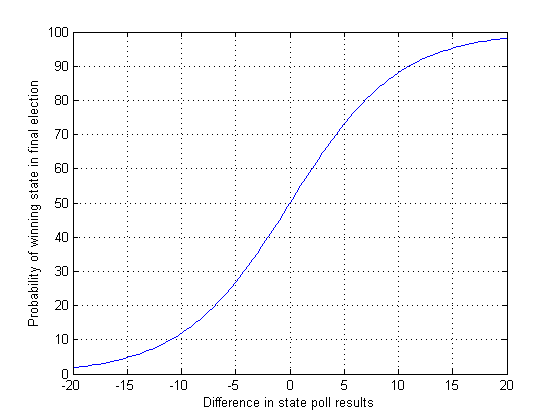
The probability that the final vote, i.e. the actual election, will give the majority to the candidate who is currently ahead in the polls, is a function of the current difference in the polls (i.e. D-R). If you have a 20% lead in the polls it is more likely that you will eventually win that state than if you have a 5% lead. The reasons why the current poll results give you only a statistical measure of how that state will vote are (1) inherrent errors in polling data, and, (2) people might change their mind by the time the election is held.
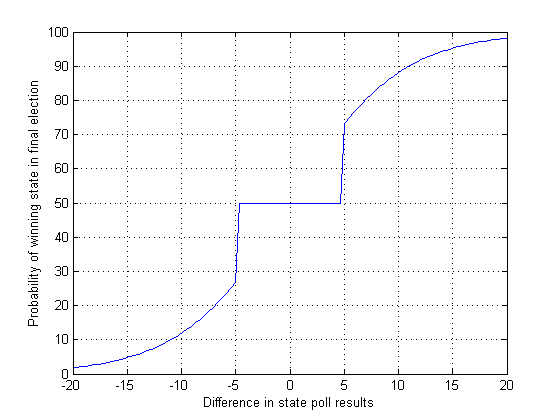
The probability-of-winning-the-state vs difference-in-poll-results function should start at 50% for a zero difference, approach 100% as the difference approaches 100%, and approach 0% as the difference approaches -100%. This is reasonable, because, for a zero difference in the polls, there is a 50-50 chance that the state might go either way. Also, if the difference in the polls is very large, it is highly unlikely that the leader will lose that state come election time.
Of course, the issue is what should this curve look like? There are many possibilities, but one is shown here. Another, which treats all small differences in polls the same, is shown here.
Now, given the above, we can construct the probability mass function (pmf) of the EV’s that each candidate will receive. Let EV be the number of electoral votes a candidate will receive on election day. EV is a random variable which can be described by
EV = sum_{k=1}^{50} w_k EV_k
where EV_k is the number of electoral votes in state k, and w_k is a random variable that is equal to 1 with probability p_k and equal to 0 with probability 1-p_k (where p_k is determined based on the polls from that state).
Unfortunately, to construct the exact pmf for EV would require an unrealistic amount of computation (Evaluation of 2^50 combinations, i.e. around 10^15 combination). One way around it is to use a normal approximation for EV. This should be a decent approximation, since the EV of each candidate is the sum of 50 other random variables.
Results
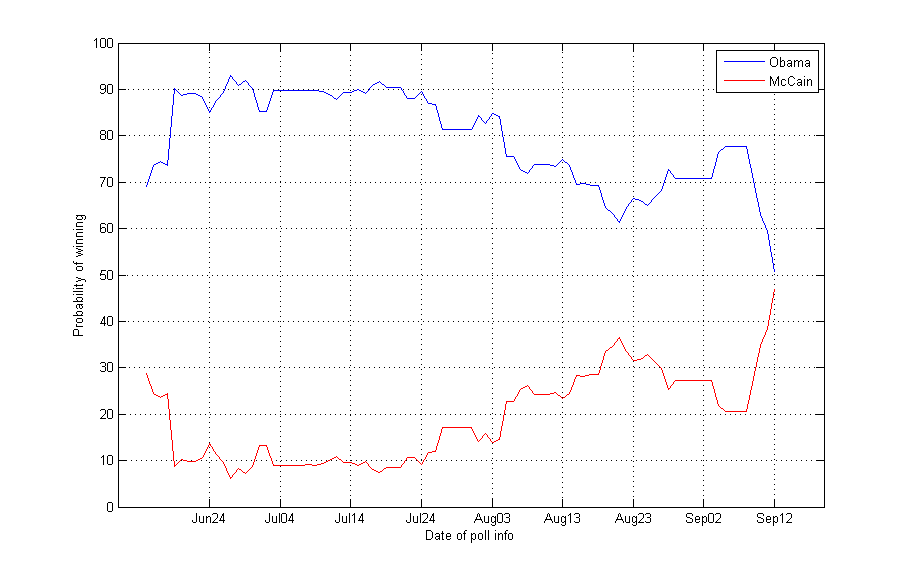
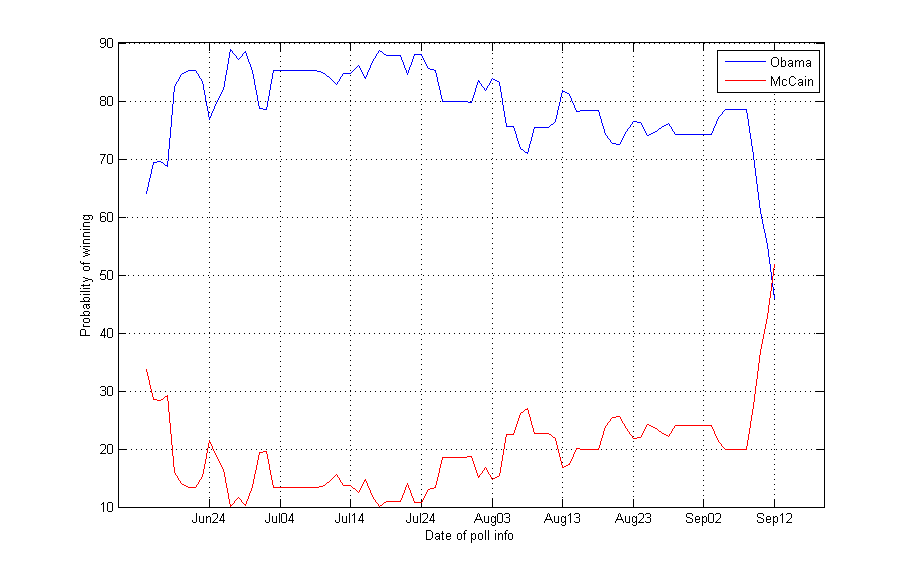
Using daily data from electoral-vote.com, I calculated the probability that Obama will win, and the probability that McCain will win, and the results are shown here and here. The x-axis represents the poll information available on a given date.
(The two sets of results correspond to the two different probability-of-winning-the-state vs difference-in-poll-results functions mentioned above)
This is not good news for Obama. McCain seems to have a very decent chance of winning. And if the trend of the recent days continues, Obama is toast. Of course, this might all be a post-convention and post-Palin-announcement “bounce” for McCain, and things may revert back to how they were a few days ago, when Obama had about 70% chance of winning. But the trend is definitely on McCain’s side.
Of course, a bunch of approximations and assumptions are behind the above results, but I thought they would be interesting to share.
