A mathematical look at gerrymandering

In today’s political environment there is a lot of talk about gerrymandering and while there is agreement, for the most part, on what gerrymandering is (drawing political boundaries in such a way to make a particular outcome more likely), there is often a failure to correctly identify a gerrymander or correctly identify who benefits from a gerrymander even when a gerrymander is correctly identified.

The purpose of this thread will be to first dispel a couple common misconceptions about gerrymandering and then to provide a mathematical framework to quantify political gerrymanders in a way that will be useful in both identifying gerrymanders and comparing gerrymanders to each other across state (or other political entity) lines.

More to follow…

Misconception #1: Proportionality

The argument goes something like, “Party X received 40% of the legislature votes across the state, but only won 20% of the seats. This is clearly a partisan gerrymander.”

Mismatched proportions alone are not enough to determine the existence of a gerrymander. In a first past the post electoral system a party that wins a significant majority of the votes in a region will generally win a disproportionate amount of roughly equal population districts within that region.

If a minority is distributed evenly throughout a state, and doesn’t have any area that is a stronghold, it can be impossible to draw district boundaries in such a way that that minority gets any seats at all. This is not merely a theoretical possibility. This is something that has actually been observed.

Dr. Moon Duchin is a math professor at Tufts University and the principal investigator of the MGGG Redistricting Lab which is a project that has among their goals: “To pursue cutting-edge research in the basic science and practically relevant applications of geometry, topology, and computing to the redistricting problem.”

Here’s a transcript of an interview (you can listen to it at the link as well) she gave with Quanta Magazine along with a couple paragraphs that summarize a real world example of a case of a gerrymander that wasn’t.

Moon Duchin on Fair Voting and Random Walks

Duchin: Yeah, my group did an analysis of our home state of Massachusetts, and what we found is that particularly in the 2000 to 2010 census cycle, there was actually no way. So even though Republicans get a third of the votes and more here in Massachusetts, even though there are nine seats, your heart may desire a third of the votes to produce a third of the seats, what we found is it’s not only difficult to get a third of the seats to go Republican. It is impossible to get even one.

Duchin: That is a long run of futility. And so at a first level of analysis, your gut feeling that that sure sounds like a Democratic-favoring gerrymander. And when we went to look at that, we were able to prove that it isn’t, that not only is the neutral tendency to get no Republican seats. It’s actually literally impossible. Even, it turns out, if you drop contiguity and you just grab precincts from all over the state greedily for Republicans, you will not find a single Republican district for those voting patterns that I was talking about.

So we see, that by itself, a disproportionate number of seats is not sufficient to show that a political gerrymander exists. When the minority is completely concentrated in one part of the region proportional representation can occur. When the minority is roughly evenly spread throughout the region the minority can be shut out completely. Reality is typically somewhere in the middle so representation above zero and and less than proportional should be expected.
Misconception #2: District shape

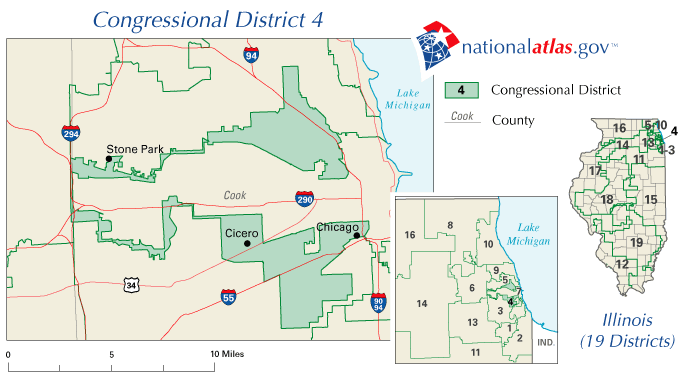
A specific example of this argument is, “Just look at IL-04, Democrats gerrymander too.”

From 1992 to 2013 Illinois’s 4th congressional district looked like this (from Wikipedia):

There have been some tweaks since then and now it looks more normal but still kind of bad, but this version is the most suspect looking.

This is indeed a gerrymander, but it is what is called a beneficial gerrymander. The goal of this district was to create a majority Hispanic district in the Chicago area. The “earmuffs” join the heavily Puerto Rican Humboldt Park and the heavily Mexican Pilsen neighborhoods (north earmuff and south earmuff respectively).

How this gerrymander arose is a different story. This map is the result of a court decision in Hastert v. State Board of Elections where a three judge panel chose the map submitted by Hastert’s side as the most fair. Side note: the Hastert in question is Dennis Hastert, notable Republican Speaker of the House and sexual abuser of tons of children.

Congressman Luis Gutiérrez (D) won this district every election from 1992 to 2016 and did not seek reelection in 2018. His worst showing in these thirteen elections was a D+50 squeaker in 1994. The result of all these lopsided elections was a lot of wasted democratic votes, and wasted democratic votes are a net benefit to republicans statewide.

The lesson here is that odd shaped districts do not tell the whole story and gerrymandering is best evaluated by examining the net effect of the entire district map and not by looking at the shape of any particular district.

That said, democrats do gerrymander too, but this district is not an example of that phenomenon.

This example also touches on racial gerrymanders. Racial gerrymanders can be used for the benefit or detriment of minority groups. I’m not planning to dig very deep into racial gerrymanders but this example demonstrates that a gerrymander can simultaneously help a subgroup of a party while hurting the same party overall.

Fairness

What does fairness mean in this context? It doesn’t mean proportional representation and it doesn’t mean that all districts have nice shapes. I think everyone would agree that a fair legislative district map should reflect the will of the people. This means that if a party wins the majority of the votes statewide then that party should also win control of the legislature in cases where the entire body is on the ballot at once. In mathematical terms that means the electorate of the median district should be similar to the overall electorate. By definition the party that wins the median district wins control which is why, in a fair map, the median district should look like the mean district.

In short, for a districting map to be fair, the median and mean districts should have roughly the same lean. Note: the similarity of the median district to the mean district is a necessary condition for fairness but not a sufficient one, but that’s not really the focus of the discussion right now.

To demonstrate what this means in practice I’m going to compare the 2022 election of the lower chambers of the legislatures of Colorado and Wisconsin. These two states both have around 5.8 million people, one large city (Denver is a little bigger than Milwaukee), and one very liberal college town (Boulder is a little smaller than Madison). Colorado is 81.3% white compared to Wisconsin’s 80.4%. They are not identical states by any means, but they form a good pair for comparison.

For each state I am going to look at the average of all statewide races broken down by state legislative district. Furthermore, I’ll be using two party vote share rather than share of the total vote. The purpose of this is to even out any candidate quality and third party effects. Directly examining the races for the state legislative seats is less desirable because of those effects and more importantly because many of those races are uncontested.

I hope I can talk people into supporting the belief that proportional representation IS the best representation. It’s why almost all of the world’s better democracies (I believe we’ve slipped to No. 29) use a form of PR.

You can’t fix the gerrymandering problem while retaining single member districts and FPTP elections. Although we CAN improve the districting process without going there; we should just aim for better.

Colorado

The Colorado House of Representatives has 65 seats and each seat is up for election every two years. In the 2022 election Democrats won 46 (70.77%) seats and Republicans won 19 (29.23%).

There were six statewide elections in Colorado in 2022:

  • Attorney General
  • Governor/Lieutenant Governor
  • Secretary of State
  • State Board of Education Member - At Large
  • State Treasurer
  • United States Senator

All six races went blue. The closest race, State Board of Education, went D+10.8% and the biggest win was by incumbent Gov. Polis who won D+19.8% (note two party vote share is used throughout). The population (number of votes) weighted average all six races breaks down as:

  • D: 56.85%
  • R: 43.15%
  • Net: D+13.7%

Note that Dems hold 70.77% of the seats but only won 56.85% of the vote. As discussed previously this alone can not tell us one way or the other whether the legislative map is gerrymandered.

When we look at each of the 65 house districts ranging from R+56.14% to D+78.54%. 46 districts lean D and 19 districts lean R and nicely these are exactly the 46 districts Democrats actually won and the 19 districts Republicans actually won. The median district is D+14.2% which means the median district is 0.5% more D leaning than the mean district. There are zero seats between the median and mean seats. So theoretically if the Republican party could move the needle enough so that things were 50/50, the House would be up for grabs. Technically the 0.5% difference between the median and the mean is a slight advantage for the Dems, but it’s so slight it would probably be swamped by other noise in the process.

We can calculate other more stat-nerdy type stats which I will present but not go into tremendous detail on:

  • n 65
  • median -0.1421
  • mean -0.1371
  • variance 0.0941
  • standard deviation 0.3067
  • skew -0.0937
  • kurtosis 2.6865

Finally, here’s a histogram of the distribution of the lean of seats in quarter standard deviation buckets centered on the mean. It’s not perfectly symmetrical or anything, but it’s pretty close considering that I’m pretty sure no one involved in drawing the map was trying to make it symmetrical.

Google Photos

Data and calculation here: State legislature gerrymander - Google Sheets

Raw data: Election Results Archives

Wisconsin

The Wisconsin Assembly has 99 seats that are up for election every two years. In the 2022 election Democrats won 35 (35.35%) seats and Republicans won 64 (64.64%).

There were five statewide elections in Wisconsin 2022:

  • Attorney General
  • Governor/Lieutenant Governor
  • Secretary of State
  • State Treasurer
  • United States Senator

These races went three blue two red. The results ranged from R+1.5% in the treasurer race to D+3.4% in the governor race. The population (number of votes) weighted average all five races breaks down as:

  • D: 50.26%
  • R: 49.74%
  • Net: D+0.52%

Whoa, whoa, whoa… statewide things are pretty much dead even but the Wisconsin Assembly is 64 R to 35 D.

When we look at each of the 99 assembly districts ranging from R+46.77% to D+82.29%. 37 districts lean D and 62 districts lean R and which doesn’t quite match the 34 D 65 R actual results, but all the mismatches occurred in very close races. The median district is R+12.53% which means the median district is 13.0% more R leaning than the mean district. There are fourteen (!) seats between the median and mean seats. So Democrats would have to do thirteen points better on average than they did in an election where they won three of five statewide races to have a 50/50 shot at controlling the Assembly. This is what a gerrymander looks like. The district lines are drawn in such a way that Republican control of the Assembly is all but guaranteed.

We can calculate other more stat-nerdy type stats which I will present but not go into tremendous detail on:

  • n 99
  • median 0.1253
  • mean -0.0052
  • variance 0.1072
  • standard deviation 0.3274
  • skew -1.0542
  • kurtosis 3.0566

Finally, here’s a histogram of the distribution of the lean of seats in quarter standard deviation buckets centered on the mean. That’s one long heavy tail. It’s an affront to the concept of democracy.

Google Photos

Data and calculation here: State legislature gerrymander - Google Sheets

Raw data: Election Results

Misconception #3

“Due to the urban/rural divide and something something population density, Republicans have a structural advantage built into the system.”

No. See Colorado.

However, a “nice shape” is a side effect of creating districts that match groups who feel close to each other. Since people can belong to multiple groups, it can be an impossible task, since you might have to choose between demographic closeness and physical closeness. But physical closeness cannot be entirely discounted when it comes to how “your” representative will push to allocate spending, if you live so far away that your area is an afterthought in their priorities.

One data point does not disprove a tendency.

If you can demonstrate that district lines drawn based on physical closeness produce fairer results I would love to see it. Not a sarcastic looove. I would really love it.

One data point is exactly enough to serve as a counterexample.

There may be a tendency. There may not be. If there is a tendency it can be overcome. See Colorado.

One approach that I think is interesting to test gerrymandering is a Monte Carlo simulation. The idea is that you take a state and then randomly generate lots of different district maps and then model the predicted results from each map. This will give you a range of outcomes in the state legislature or Congress. Then you can see where the actual results fall in the simulated ranges.

I’m happy to recommend looking into Dr. Moon Duchin’s work concerning random walks and gerrymandering. Here’s a video: Math Lovers Forum at MSRI: Moon Duchin on "Random Walks and Gerrymandering" on Vimeo

Abstract:

Dr. Moon Duchin of Tufts University spoke to MSRI’s Math Lovers Forum (mathlovers.msri.org) in September 2018. Markov chain Monte Carlo, or MCMC, is a powerful family of search algorithms that has applications all over science and engineering. Dr. Duchin makes the case that it gives us the material for a major breakthrough in the study of redistricting: how do you decide when a map has been gerrymandered?

How are you getting this from my post? I said that closeness can be a factor, not the only factor. It is literally impossible to prove that something is fair when there are more than 2 options.

How many cubic kilometers of rock do we need to haul into Kansas to build all those ski resorts?

How do you generate the maps? There are a lot of different procedures that could be said to produce “random” maps, that would have very different results.

Random walks. See Dr. Moon Duchin.

ISTM the entire enterprise of the thread is intellectually faulty. Well intentioned, but built of smoke flowing from a mirror.

Once we want/need to have districts driven by racial makeup, or by SES, or by any criteria other than simple mathematical compactness, we’re just bickering about which political considerations we choose to cheat to help and which political considerations we choose to cheat to harm. At that point it’s all politics, and trying to give a math / science veneer to simple politics is a nonsense.

All boundaries driven by political considerations are gerrymandered. Period. That’s what the word means.

Getting what exactly?

You put forth something about geographical closeness being an important consideration and I would like to see more if you could provide it. I am interested in your idea and would like you to expand on it.