Okay, so as a professional biologist it pains me to admit this, but I know little to nothing about statistics. I can do a Chi-squared analysis on Mendelian ratios and a Mann-Whitley U-test for a single parameter, but that’s about it.
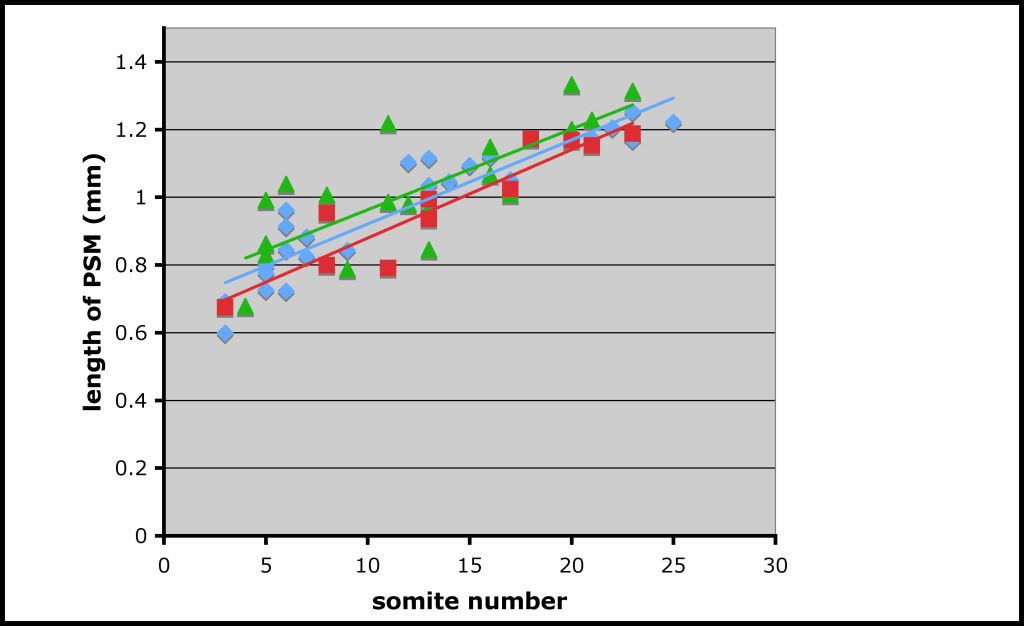
So I currently have a data set that has two parameters - age of the mouse embryo, and length of a particular tissue - with three different mutant genotypes. When I do a scatter plot of the data, it looks like this. The different colors represent different genotypes (I had Excel add “Trend lines”, whatever the hell those are.)
So, to my eye, there is no difference between the different genotypes (colors), but I need someone to point me towards the right test to use to actually get a p-value out of that subjective judgment. Anyone want to lend a hand?
I assume you’re trying to determine whether the association between age and tissue length differs across the three genotypes. If that’s correct, you want to do a regression model (probably a linear regression) in which the dependent variable (the thing you are trying to predict) is presumably tissue length, and the predictor variables are age, genotype, and the interaction of age by genotype. (The interaction is the effect you are interested in.) The one thing that is a bit tricky is that the genotype variable has to be represented by a set of two indicator, or “dummy”, variables, which will mean that the interaction effect will also be represented by two dummy variables. It might be better to find someone who can walk you through that in person. (You could avoid that problem by running a set of three models, each comparing one pair of genotypes – A vs. B, B vs. C, and A vs. C… that’s not the standard way of doing it, though, because it raises the issue of what is called “multiple comparisons”. Generally, when you do that, you correct for it by using a more stringent criterion of significance than you otherwise would.)
Actually, the thing I’m trying to establish is whether genotype makes a difference, i.e. whether the length of the tissue is longer or grows faster in some mutants than in others.
I think (if I understand it correctly) that linear regression will tell me how fast the tissue is growing in each genotype (i.e. the slope of the line), but will not tell me if the lines for each genotype are the same. Is that correct?
If you do the linear regression model I outlined – i.e., with the interaction of genotype by age included, as well as the main effects of genotype and age – then the main effect of genotype will tell you if the tissue length (averaged across all ages) is greater for one genotype than another, and the interaction effect will tell you if the speed of growth (i.e., the degree of association between age and tissue length) is greater for one genotype than another.
cjepson’s suggestion to use dummy variables is the simplest way to approach this, but you can’t do multiple regression in Excel. What else do you have access to?
I’m not sure - I don’t even know what to look for. I work at the NIH, which has site licenses to a fair amount of software, if you could suggest some names I could go looking for.
look for stata, spss, sas, R. The problem is, you need to know what you are doing (ie know the software). For the record I would also try the proposed regression model, just make sure you have one dummy less than you have categories (so in your case only 2 dummies and interaction effects) the result you get will tell you hwo that particular category does compared to the one you didn’t include…this also means that one model will not tell you whether the two categories that you did give a dummy are different from each other. In order to know this you need to run another model where one of the other categories is the one that is the base (so not with a dummy). I must say that at a glance there seems to be little difference…but if your sample is large enough there might still be significant outcomes.
ps I think I once heard somebody talk about doing regressions in excel, so it might be possible, don’t ask me how tough.
You can do multiple regression in Excel, unless I misunderstand what you mean (multiple independent variables, one dependent variable, right?). I did this in a course I took in forecasting a few years back but haven’t used it since. There is a regression tool built into the Analysis ToolPack which ships with Excel, but isn’t installed by default. It’s more powerful than the TREND function and will give you a sheet with all the parameters for the model, like R[sup]2[/sup]. I think you can even do multiple regression with TREND if you set the columns up right. But frankly this is a little like removing a screw with a pair of pliers.