Is that by weight or volume?
Oh, man, what if it was by sheer head count?
(Now I’m picturing some poor biology grad student sitting next to an anthill: “53,048 … 53,049 … wait, quit moving!”)
INsufficient? I thought the problem was too MUCH CO2 being released.
What can we do to help replenish the vanishing CO2 supply? Would increasing the number of coal-fired electric plants help? Is it too early to start thinking about burning down the Amazon forests and banning electric cars?
I think we better get on top of this pronto. Also we must try to lower the planet’s average temperature.
No reason why we cant do both at the same time.
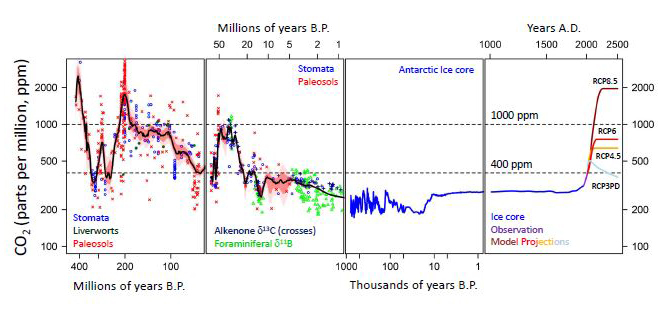
According to your chart, in the last hundred years we humans have put our CO2 levels back to where they were 400 mllion years ago, so I’m not sure why you think it will all disappear in the next two million.
Look at the chart closely
I admit that I didn’t notice that the on the far right are projections. So we aren’t actually up to 2000 ppm yet (although we could be in the next hundred years under the worst projection). Still, we are at about 500ppm which is where we were about 20 million years ago. There is no danger of us running out of CO2.
How about you explain what you think the chart shows, instead of asking others to figure out what you’re getting at. Because… this chart ends at the year 2500, not the year 2 million.
If you look at the chart closely you will see several times in the last 1,000,000 years it has dipped below 200 which is dangerously low, 150 is considered the end to plant life. The downward trend is evident. Most likely in the next 1/2 million years we will experience some mass extinctions from low carbon and if the downward trend continues life will just be done here with no saving it.
And yet it never has gone that low (150) before, despite flirting with it. Why do you assert that it is “almost certain” to do so now (next million years) when it never has before?
Because of the long running downward trend
Because of the long running not downward trend . . . that (as far I can can tell) the chart shows ended decades ago,
What is the source of this chart?
Apparently.
Looks more like well over 10 thousand years ago; and pretty much by 1000 thousand years ago. Which would not have been human intervention; we weren’t doing much of anything a million years back (well, we were doing a number of things, but not things which would have significantly affected the climate.)
And even if there were an overall downwards trend that might have eventually caused problems: that doesn’t change the fact that CO2 is way too high now, with no guarantee of the leveling-off to entirely flat that they’re projecting. If your house is about to be underwater from floods right now, even if there’s going to be a drought a million years from now you still need to do something about the current problem if you want to be able to live there.
I assume that you are talking about the long slope at the end of the middle graph. It only appears to be a long running downward trend because of the log scale of the axes. In fact its only about 5 million years, which is about half the length of the dip and return that happened between 10 and 20 million years ago. So no its not a long trend yet, and there is no reason to believe that it would continue forever, and in any case it was entirely reversed and then some over the hundred years of human intervention.
Alternatively you could be looking at the first graph and the 100 million year down trend, which is less than the loss that happened between 400 and 300 million years ago, but which was reversed over then following 100 million years. But don’t worry if we keep up the way we have been going we should get back there in another 100 years or so and be all ready for 4 foot millipedes.
Without human intervention at all it would probably fluctuate some as it did throughout earths history. We would have more ice ages and periods of warmer climes. If it did start getting too low evolutionary pressure would start making plants use less CO2 which would then cause levels to level off or start rising again. In any case life goes on.
The first part of that has the oceans evaporating within 600 million years. The second part of that says that life may survive in the hydrothermal vents for as long as 900 million years. How are there supposed to be hydrothermal vents when there aren’t any oceans?
– in any case, 500 million years is a whole lot longer than 2 million years. 500 million years is more than twice as long as there have even been mammals. The chances that humans will last that long as a recognizable species are zilch. If we’re going to have descendents, we need to first stay alive on a lot shorter time scale than that.
Have you never heard of C4 carbon fixation? That’s good down to about 10ppm, and evolution is pointing that way. Without human intervention, many plants will adapt to lower CO2 levels.
With human intervention, either the CO2 levels will be artificially raised by burning kerogen, or more plants will be genetically engineered to tolerate low CO2. Or both.