Physics of drag and braking ability.

I’m hoping this is a simple physics question. The example is related to aeroplanes but it should have a general answer I would think.

Example:

I recently had to fly a BAe146 in to a short runway (1500m) with a significant tail wind (10-15 knots). We have two models of 146, small (146-100) and large (146-300). The small one is lighter (obviously) and shorter but otherwise the same as the bigger one. The frontal area is the same and it has the same wing, engines, wheels, brakes etc.

During the flight planning it became apparent that the smaller 146 needs more runway than the bigger one when landing with a tailwind at the same gross weight. With no wind the landing distance is the same and with a headwind the smaller plane needs less runway.

E.g., the required runway in meters for landing:


Type | Weight    | 15 knots TW | 0 wind | 40 knots HW |
     |           |             |        |             |             
-100 | 33,000 kg |    1700m    | 1220m  |    890m     |
-300 | 33,000 kg |    1620m    | 1220m  |    920m     | 


This hasn’t really come up before because we normally fly to long runways and the distance required, or max landing weight for a particular runway, is of academic interest only.

It boils down to this, the smaller aeroplane is more affected by wind, both positive and negative, than the larger one. Why would that be? Given the only difference is fuselage length I’m thinking it is to do with surface area to weight ratios and drag but I may be barking up the wrong tree.

Ground effect will be the same for both. But given the 146 is high winged, that really shouldn’t matter. Interesting problem.

Still it might be enough to matter. Extra mass of the bigger plane will stick it down more.

Yeah, it’s the mass. F = ma. If they both have the same force on them (due to same shape and same cross-sectional area), but different masses, the one with the larger mass will have a smaller acceleration.

Chronos, note that although the 146-100 airframe is lighter, the landing distances here are given for the same total mass (including payload & fuel). It’s a more subtle effect, interesting question.

Here’s a diagram with a side view of the two aircraft.
http://www.findmodelkit.com/sites/default/files/p3281143_0.jpg

And specification here, confirming that other dimensions are identical
https://www.airlines-inform.com/commercial-aircraft/BAe-146.html

Ah, I overlooked that. That is indeed puzzling, and my first guess (that the heavier model has a stronger engine) would lead to the opposite result.

It’s possible that a longer fuselage is a more aerodynamic shape (smaller CdA). But the short version is already a streamlined shape so I would not have expected that making it longer would make it more aerodynamic.

The long version has more separation between the wings and tail, so maybe that reduces the drag created by the interference between the two? (ie the tail sees a less turbulent air flow)

My first thought is that it’s a little odd & coincidental that the stopping distance is exactly the same with zero wind, but differs with any wind. I wonder how they produce these figures? Could be an artifact from the way these tables are produced? Presumably not every single point on the table is a measured performance, they must work from base measured performance figures and adjust/interpolate to some extent by calculation for different weights/winds?

In any event, if the effect is real…

The shorter aircraft would probably have less lateral controllability on the ground under braking, because of the shorter distance between main gear and both rudder and nose gear. Similarly, elevator authority on the ground at a given airspeed would be greater for the longer aircraft, but I’m not sure how that affects braking. There are presumably some other subtle aerodynamic effects from the different length, even with identical wing and empennage. The 146 has both lift dumpers on top of the wing and a funky speed brake on the tail, I don’t know if that’s relevant.

But whatever factors are relevant, I’m still stumped about how it ends up being asymmetric for high/low groundspeed.

By the way, is the landing speed also the same for no wind, but different with wind?

Yes, good question. That may be the simple solution.

Actually, I think there’s an even simpler solution. How were these numbers obtained? If it’s just from a measurement of one landing per aircraft per wind conditions, or an average of a small number of such measurements, then we could just be seeing random noise. Maybe the pilot on one run just happened to hit his touchdown target right on the nose, or was just a little bit better at opening the flaps at just the right time, or whatever.

The engines are the same and don’t have any reverse thrust. Stopping is all from brakes and drag (spoilers and air brake).

The landing speed (airspeed) is the same for all wind components. If it is gusty then you can increase the landing speed but the landing distance is the same for up to 7 knots increase in landing speed, i.e., the same tables are used. The tables have a lot of fat built in to them to allow for minor variations such as this.

Yeah I’d wondered that. The numbers themselves are tabulated from graphs but I’m not sure what the details of the flight testing are.

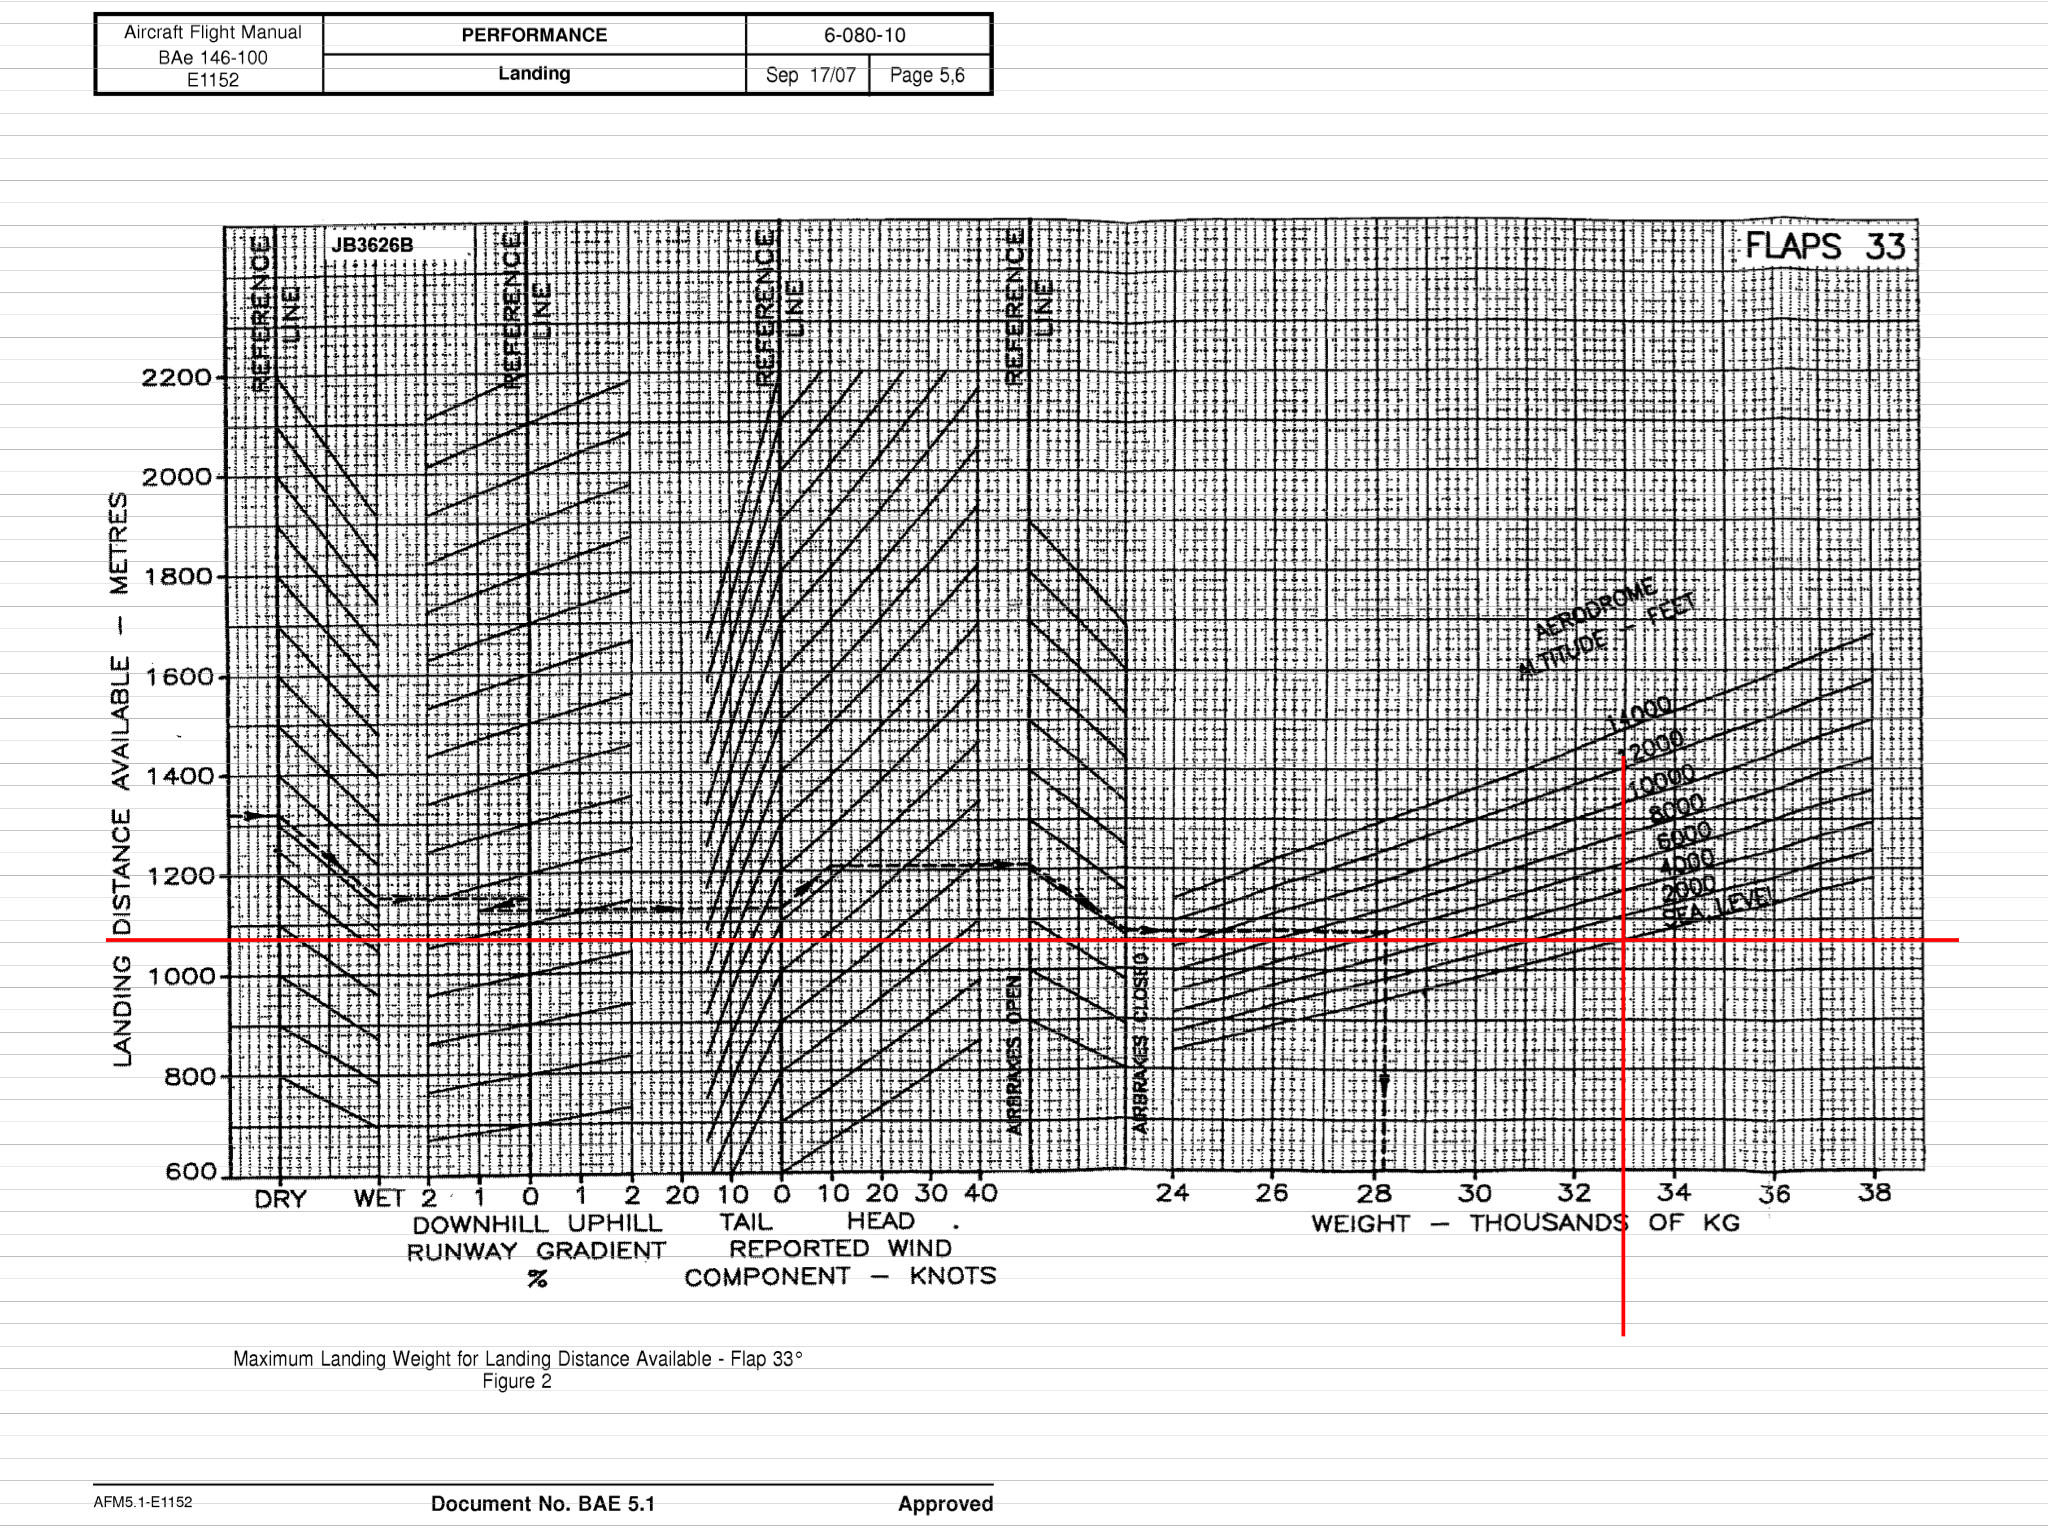
I have the graphs as well, but they’re in electronic format and I can’t easily compare them. I have a suspicion that the graphs are essentially the same as each other and that the landing distance and weight lines have just been “moved” for each type. This means that the 33,000 kg data is graphed on a different part of the graph in the different aircraft because in the -100 this weight is close to the maximum landing weight while on the -300 it is about 5000 kg below max landing weight. If this is the case then it may be an error.

Another consideration is that these graphs are factored, they don’t reflect raw data anywhere at all. The wind lines are factored such that the headwind lines account for the stated headwind minus 50% and the tailwind lines account for tailwind plus 50%. The reason being that this allows you to comfortably use reported wind without worrying about it being a knot or two different in reality. They are also all factored by 67% over the flight test data. If the flight test resulted in a landing distance of 1000 m, then the graph will say 1670 m at least. This is to allow for the fact that most airline pilots are not test pilots.

I wonder if weight transfer under braking might be part of the answer. Step on the brakes and you put more weight on the nose gear and less on the mains (relative to standing still, or not braking). A shorter wheelbase would experience more weight transfer than a longer one. Lift weight off the four main wheels and transfer it to the two nose wheels and braking performance suffers.

My dad used to fly these and took delivery of new ones from the factory. I wonder if he’d know the answer, or know someone who does.

But if that were the case, the longer plane should have a shorter stopping distance under all wind conditions, no?

I don’t think the numbers are cast in stone and the aircraft are absolutely exactly the same so they have the numbers with that fudge factor saying that 99.9% of the pilots & aircraft should be able to do x, y & z. But if chance lines up the worst aircraft with the worst pilot on their worst day and the worst condition for that particular aircraft of the thousand being used and you get ‘pilot error’.

Move any one thing from the worst column & the fudge factor will probably save the day. That is the kind of safety margins humans can live with and lawyers and corporations and…

Take a one off aircraft with only one ever pilot and what he can make it do or not do is the only numbers that mean anything. That is why there are a few pilots that generally can beat the numbers every time without ever trying or thinking about doing so.

IMO, when you get up the transport category aircraft they can’t spend the $$ for more testing with non top of the heap pilots to get the numbers for more accurate information.

If their was a way to track every flight and every operator of the controls to get exact numbers and also the times the pilots say they were trying for best smoothness, distance, fuel economy, what they perceived as the actual conditions, and on & on, well, that way lies madness and serves safety no better than what is being done now. Fudge factors. Easier to do with metal than with humans.

So, IMO, these differences are just cover their asses more than real world actuality. Show data the the bigger/smaller planes are consistently on average using that much more/less then the other aircraft on all flights with all pilots, and then you have as provable numbers. But as small as the differences are, it is just some random guess work and has not been proven wrong.

I don’t think there is a provable design/physical solution to the question because there is not a robot pilot with 100% accurate conditions to test to anywhere absolute accuracy in the data in the books. That is why there is the fudge factor.
So much cheaper to do the fudge than to spend the $$$$ when there is no provable increase in safety or gain in utilization or profit.

Over the years there were 3 different types of a aircraft of which one tail number I could easily make the airplane do things safely that the books said could not be done. Sometimes thinking and going outside the box can save your ass & the aircraft but if you give up mentally at the end of the list of things to do or think the lines of the box are absolute, you and passengers and/or people on the ground probably will die or at least you have bent a perfectly good aircraft.

The fact that the OP goes into a landing situation as he describes tells me he is way above average and knows that he will not even be close to the going over the book numbers. But he wonders why the numbers are that way. The reasons the are in the mirror, not the aircraft.

Go reread ‘Fate is the hunter’ and E G gives a perfect example of engineers vs reality. Engineers say should and Pilots live and die with does/does not.
GusNSpot, the fudge factor stuff is spot on. These numbers are definitely not the numbers the test pilots got. They are numbers designed for us line pilots who don’t have to be super good every day. Hence the wind columns have a 50% fudge factor and the whole thing has a 67% fudge factor.

This all means that the following,

isn’t quite right. I’m just doing my job. The job involves carting freight between Australia’s state capital cities up and down the east coast. One of them has a strict curfew. The only jets going in there in the middle of the night are us and another 146 operator, and we are only allowed in and out from and to the south on one runway. We have a special approval to land with up to 20 knots tailwind.

The airport takes the opportunity to complete runway works during curfew and so we are often flying in there when part of the runway is closed. Normally it’s not limiting but last week we only had 1500m available out of the usual 4 km. Add a tailwind to that and the numbers do become limiting and require a bit of thought and planning prior to departure.

So, not necessarily above average, just one of a few pilots that week who had to deal with a more extreme version of what we normally do each night. Then when we find that the little aeroplane has different numbers to the big one for the same weight, we are left scratching our heads.

Have read all of his books. Well recommended.

The more I think about it, the more I think it might be this. If the data points are limited then minor variations could easily lead to slightly contradictory results. And it’s not like the difference is big, less than 100 m. The -100 was also the first of type while the -300 came some time later, so it’s not like the pilots were doing performance testing on both types on the same day.

I have not done structural reviews on airplanes but have been on review panels where we analysed the structural stresses from loading oil platforms on barges. Something like this. These systems (sometimes as heavy as 25,000 tons) moved extremely slowly (with computerized and pneumatic controls) and yet the loads on the structure were enormous.

I think you should talk to a structural engineer. Here are somethings to consider :

1> The load on the two planes may not be evenly distributed on all the wheels. And thereby the braking force maybe different from each wheel thereby leading to stresses on the airplane frame.
2> You may not be landing exactly straight (do not know the right word for it) , so part of the airplane frame will be in shear and will have more uneven braking. Think about jack-knifing trailers.
3> The lift from the wind may reduce the braking force differently in forward wheels versus rear wheels or make them uneven between two wheels putting stresses on the frame
4> The height of the plane’s structure (center of gravity) from the ground could also lead to different moments especially when you figure in the lift. The way I visualize this moment is something that is trying to make the airplane spin backward - like a backflip.

I’ll throw in my 2 cents.
It could be due to different distance between tail and CG. This can matter when landing with tail wind. As you enter ground effect, wind speed drops off and your airspeed is now too high. Having horizontal tail further from the CG would let you bring the nose down faster/sooner.

A couple of total SWAG from somebody relatively clueless in aeronautics: I’m wondering if the longer-bodied model, in a headwind, might experience lift from the fuselage.

For the tailwind, maybe the calculations allow for a gusty wind that would have less effect on the heavier aircraft (i.e. it doesn’t need as much leeway for sudden gusts).