Confirmatory data from other experiments will be important, as it’s a difficult measurement to make. But assuming it holds up to scrutiny, it’s very exciting.
Regular followers of physics will certainly have come across pictures of the cosmic microwave background (CMB) radiation. The linked image shows a map of the sky obtained in the microwave band. Each point on the map represents the temperature (which is related to the energy spectrum) of the microwaves in that direction. The temperatures aren’t directly shown, though, as they are nearly rock-solid the same in every direction. Rather, the map shows the tiny variations around the average temperature, after a variety of less interesting effects have been subtracted out.
The colors on that map are clearly not random. There are clumps and patterns that exist over a variety of angular scales. (“Angular” is appropriate here since the map is a projection of the spherical sky.) These clumps and patterns, these correlations, are imprints of density variations present in the universe about 380,000 years after the Big Bang. The concept of “inflation” gives an attractive way to seed these density variations. With inflation, quantum fluctuations present very early on (roughly 10[sup]-36[/sup] s from the starting gun) get stretched out across the universe as it expands exponentially in the first tiny fraction of a second. These fluctuations result in subtle density variations which, in the fullness of time, result in the obvious density variations we see today (like galaxies).
This story works and gives predictions about the isotropy and homogeneity of the universe, the flatness of spacetime on large scales, the correlations in the CMB sky map, the density of dark matter, the abundance of the light elements, and more. Observations are all consistent with these predictions of inflation. So, what’s new?
Well, inflation isn’t at cut-and-dry as it might sound, and it also isn’t the only way to get the universe we see. So, it still needs to be firmed up. One stark prediction of the inflation model relates to gravitational waves. The energy scales involved in inflation are huge, like 10[sup]12[/sup] times higher than what we can access at the LHC. With such energy rippling around, gravitational waves should be produced. It is important to note here that the most straightforward interpretation of this statement is a quantum one. Quantum gravity should manifest itself. That has folks excited.
Anyway, these primordial (and potentially quantum) gravitational waves would be present through the inflationary period and would remain as the universe cooled. They would imprint signatures on the CMB when it formed 380,000 years later.[sup]1[/sup] The imprinted signature that is relevant here is something called B-mode polarization. The microwaves of the CMB are polarized a bit, and any polarization pattern can be broken down into diverging/converging patterns on the one hand (“E-mode”) and swirly patterns (“B-mode”) on the other. Gravity can give rise to B-mode polarization in the CMB.
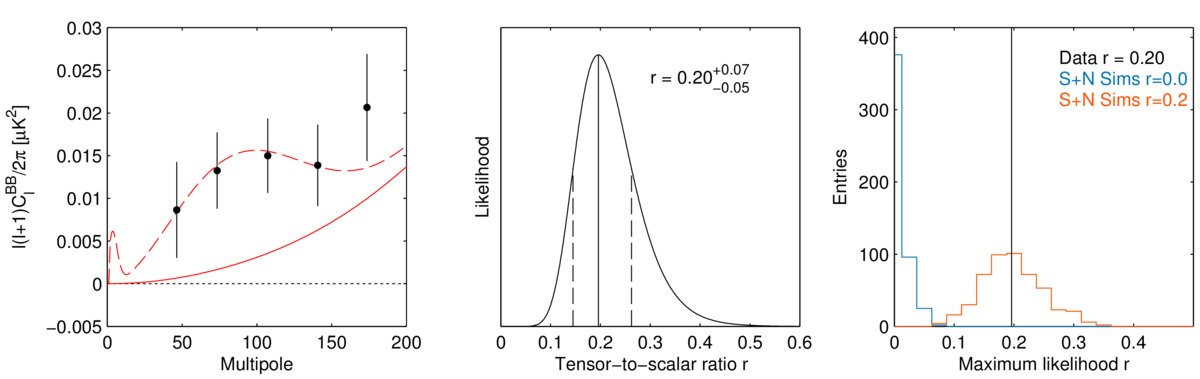
B-mode polarization in the CMB has, in fact, been measured previously, but that polarization stems from more mundane causes and has correlations across the sky consistent with those causes. What BICEP2 has done is to measure the B-mode polarization that has angular correlations that match an inflationary origin. It is nigh impossible to get such gravitational wave patterns from anything other than quantum effects happening in an inflationary epoch at energy scales that boggle the mind.
In short, this is exciting because:
- It reveals a messenger of things happening 10[sup]-36[/sup] seconds after the start of all things.
- It kills off whole schools of thought on the very early universe, although inflation has been the favored picture for some time.
- It potentially shows evidence of quantum gravity.
- It gives quantitative access to things happening at energy scales ridiculously inaccessible to terrestrial experiments.
[sup]1[/sup]It wasn’t microwaves at the time, though. It’s been highly red-shifted since then.