Sam Stone believes Trump's tweets

Well that, conveniently enough, is changing your argument.

If you are now saying, not “Stop focusing on tens of thousands of dollars in lost annual income and consider all the many many examples of compensatory huge boons for workers!”, but rather “Eh, workers couldn’t have been earning tens of thousands of dollars more than they are now anyway!”, then we can discuss that claim.

But I think the evidence pretty clearly shows that, taking into account the increasing costs of things like cars and housing and healthcare along with the decreasing costs of things like food and clothes and consumer electronics, the average worker is not saving significant amounts of money on basic living expenses now as compared to 1975. On the contrary.

Yes, nobody is denying that today’s more expensive and precarious economic life comes with massively more options and improvements and goodies of all kinds than its 1975 equivalent. But isn’t that what human ingenuity and capitalist innovation are supposed to be able to achieve while also figuring out how to make all this stuff more cheaply?

You’re expecting us to fall down and worship at the altar of market forces when they manage to invent (not entirely without the assistance of government intervention, btw) a new camera or space rocket or medical treatment. But we’re not supposed to criticize them when they can’t seem to provide ordinary workers with a roof over their head or a needed operation without dragging them into bankruptcy. That is not a good-faith argument, and I’m not buying it.

Didn’t this particular line of discussion start with JohnT’s posting of graphs that showed worker salaries rising in parallel with gains in productivity from the '50s through the '70s, and then salaries being stagnant since then even though productivity continued to climb? So, we’re really comparing two eras; 1950-1980 as compared with 1981-present. Innovations, options, and quality of consumer goods have improved over both those eras. The period between 1950 and 1980 saw huge improvements; color television, FM radio, stereophonic sound, satellite communications, cheap long-distance calling, and a host of other things.

It seems to me that Sam is trying to make the case that the period from 1950-1980 saw an increase in worker salaries, whereas from 1981-present those gains took the form of greater choice and quality of consumer goods. But that’s wrong. The sort of improvements he cites have been taking place over the whole time span in question. It’s just that since 1981 that pay has stagnated.

Note that your linked article is only comparing 2017 car prices with prices from twenty years previously, not with the inflation-adjusted prices of cars from 1975 or thereabouts.

Just for fun, let’s compare two cars that a low income person might have owned in 1980 and today.

In 1980, a very common small economy car was the Chevy Citation. It was Motor Trend’s car of the year for 1980, so it seems like a good choice.

Specs for base model:

90 Horsepower V6 (soon to be 84 with new emissions requirements)
Mileage: 21/30 mph city/highway
Four speed manual transmission
Manual windows and doors.
Heater, no AC
No airbags
AM radio
Price: $6300.
Adjusted price in 2019 dollars: $19,546

Those cars were junk within 5 years. Terribly built, they rusted out like crazy. They had no real crash protection other than seatbelts. They were gutless and suffered numerous recalls.

Fast forward to today. One of the cheapest domestic cars you can buy (Domestic to keep the comparison fair) is the Chevy Spark LS. Specs:

Horsepower: 98
Five Speed manual transmission
Fuel economy: 30/38 mpg city/highway
Infotainment system with bluetooth, wifi hotspot and 7" touch screen
Rear View Camera
10 Air bags
Rear obstacle sensors
ABS brakes
Stability control
Price: $13,400

The new car is $6000 cheaper than the Citation, but is full of safety features the Citation didn’t have. Also, construction is much better these days, the steel is stronger, the cars don’t rust nearly as much, and in general you can expect this car to last maybe twice as long as the Citation did when new.

If we go up to the top trim level, you also get alloy wheels, performance tires, tire pressure monitoring system, power windows and door locks, remote keyless entry, cruise control, a six-speaker stereo, satellite radio, steering wheel-mounted controls, keyless start, alarm system, leather-wrapped steering wheel, air conditioning, heated front seats and heated outside mirrors.

That car has specs better than what you could have gotten in a Cadillac in 1980. And it costs $16,400, or over $3000 LESS than a 1980 Citation. If you tried to spec out a car from 1980 that had all the features available at that time (power windows and locks, cruise control, alarm, leather steering wheel, air conditioning, etc) you’d be into a lot more money.

Also, the new car will be way more crashworthy.

Oh, and a four year car loan in 1980 had an interest rate of 14.3%. Car loans today, depending on credit, range from 0% to 5%. So let’s figure out the cost of the car if paid out over 4 years:

Citation
$6300 base
Payment: $173.11 (14.3% interest)
Total Cost: $8309.28

Spark:
$13,400
Payment: $302.56 (4% interest)
Total cost: $14,522.88

Now, if we convert the Citation payments to 2019 dollars:

Payment: $537.10
Total Cost: $25,790

So once you factor in the lower cost of borrowing today, the Citation is over $10,000 more than the Spark, and a poor family would have to pay $235 per month more.

You can add even more when you factor in maintenance. Modern cars have longer warranties and require less maintenance. No carbs to adjust, the plugs last 100K, etc.

That’s not trivial. And that’s not considering how much better the Spark is. I’d guess that a car that had the features and quality of the Spark in 1980 would have been more like double the cost of the Citation. And many of the features the Spark has weren’t even available then.
Someone remind me, what’s the conservative position on the regulations that give us those nice MPG numbers and airbags again?

Not exactly a fair comparison; “a very common small economy car” from 1980 with the absolute cheapest new sub-compact car (about 3 feet shorter than the Citation) available today. And it’s assembled in South Korea, so not exactly “domestic”.

And my research comes up with a base price of $5,677 for the Citation in 1980.

Um, I notice that you’re comparing a “very common” 1980 Chevy Citation, which was by no means “one of the cheapest” available at that time, with a 2021 Chevy Spark LS, “one of the cheapest domestic cars you can buy”.

Of course, if you were buying a 1980 car that was similarly “one of the cheapest domestic cars”, you’d have paid less than $4000 for it and its inflation-adjusted price would be under $16000.

Furthermore, of course, the 1980 Chevy Citation was built by US union autoworkers getting paid a wage that would be upwards of $30/hour in today’s dollars. The 2021 Chevy Spark LS is built by autoworkers in GM’s South Korea plant who earn about $8/hour. Well, that explains quite a bit right there.

Or, what he said.

That said, and even with a bit of side-eye at your perhaps optimistic estimate of the Spark’s longevity, of course it’s quite true, as I acknowledged previously, that modern consumer options in general are way better than they were back in 1980. But so what? That, as I said, is what the miracle of human ingenuity and market innovation is supposed to be able to do for us: continually produce improved products at lower costs.

What I don’t buy is the argument that it somehow wouldn’t have been possible to do this without keeping the median worker’s income essentially stagnant, when higher-bracket earners saw their incomes increase by so much more. For example, according to JohnT’s table in post #1016, in 1975 the 90th-percentile income was about 1.8 times the median income. By 2018 it was 2.66 times the median income. And the multiplier effect of higher-percentile incomes, of course, increased even more.

So the upper 20% or so of earners get all the wonderful new consumer improvements AND disproportionately increased incomes (which enables them to afford the rising prices of the big-ticket items like housing and healthcare), while the middle- and lower-tier earners get all the wonderful new consumer improvements but essentially stagnant incomes.

That’s just plain arbitrary. It’s not that we’re all getting wonderful new consumer improvements and putting up with income stagnation because the wonderful new consumer improvements enable us to live so much more cheaply. It’s that the system is clearly set up to favor disproportionate income accrual by the higher earners.

Consequently, the higher earners are far richer in real terms than they were in 1980, while the median earners are struggling with stagnant income, higher major expenses, and increased debt. It doesn’t have to be that way, and the perks of having nice new airbags and long-lasting spark plugs and so forth don’t automatically make it okay for it to be that way.

Enough with the cooing over the shiny new toys (which, yes, they are lovely and shiny, good work inventors and automakers!), and back to serious consideration of whether and why we really can’t have both shiny new toys and financial stability for the non-wealthy.

My issue with the “a rising tide lifts all boats” apothegm is that it relies on the unexamined assumption that everybody is in a boat.

Hey, why don’t y’all take this to GD? I haven’t read the word “fuck” in this thread in forever. I liked it better when y’all were justifying the Pit’s existence.

“A rising tide lifts all yachts.”

Fuck you.

Happy now?

Very. Thank you. Please continue your discussion now.

I remind everyone that CPI: New Cars takes into account quality changes and has been consistently lower than CPI: All Items. Both overall transportation spending and spending on vehicle purchases as a share of household spending have been on a downward trend.

But that’s really neither here nor there when it comes to overall well-being or whatever point is being attempted. Transportation, clothing, and food has gotten cheaper. But housing and health care has gotten more expensive. Apples to apples comparisons are difficult (e.g. the housing stock is bigger now.)

I really don’t want to wade too deep into this, but as a car guy I’ll throw my 2 cents in.

The Chevette would have been the closest thing to the Spark available in 1980, and it had an MSRP of somewhere around $4418, much, much closer to the Spark. It was a piece of shit, yes, but so is the Spark for that matter. Sure, the build quality of the Spark is much better, and it has some modern tech in it, but it’s small. Very small. It’s not a family car, whereas you could probably actually put human beings in the back seat of a Chevette. Conservatively, Chevy sold 10 times as many Chevettes as it’s currently able to sell Sparks.

A better comparison, less favorable to you, of course, is to just compare a 1980 Corolla to a 2021 Corolla. The 1980 Corolla was yards better than the Chevette, or even the turd of a Citation (included on Car and Driver’s list of “Most Embarassing Award Winners Ever”). Is the modern Corolla better? Natch. It also costs $2800 more in inflation adjusted dollars.

But Toyota’s brand cachet has risen tremendously over the last 40 years, so maybe a more fair comparison would be with a 2021 Kia Forte, a direct competitor to the Corolla but with the “Kia stink.” The Forte’s MSRP is still more than inflation adjusted 1980 Corolla’s.

I was saddened to learn that the US has lost the trust of our allies around the world because we have become too woke and didn’t re-elect Donald Trump. Thank you for that shrewd observation, Sam.

I was going to point this out, too. Everyone back then knew that the MT Car of the Year award went to whoever bought the most ads, and that the Citation was crap.

No. EPI (in the plot you posted - I hadn’t noticed this is from their 2015 report which switches to compensation) is comparing the productivity of everyone, deflated by IPD, to the total compensation of production and nonsupervisory, nongovernment employees, deflated by CPI. HF shows a line for wages of the smaller group (in response to EPI’s use of base wages in earlier reports) and a line for total compensation for everyone, not just for the subset. BLS doesn’t break out total compensation for the subset, so HF uses the BLS data for everyone and EPI calculates for the subset. Whether they do a good job or not, I don’t know because they don’t show their math. But I’ll assume it’s accurate for now. The two changes between the wage and compensation lines in the HF plot are adding both total compensation and for everyone, not just the production and nonsupervisory subset. I would have captioned the figure better if my goal were neutral information. But, it’s HF.

You may not like parts of total compensation but the list I quoted earlier is good enough for EPI, BLS, etc. And benefits comprise 20% of compensation for the bottom civilian 10th percentile, as opposed to 32% and 33% for the median and 90th, respectively. So lower but certainly not “minimized if non-existent.”

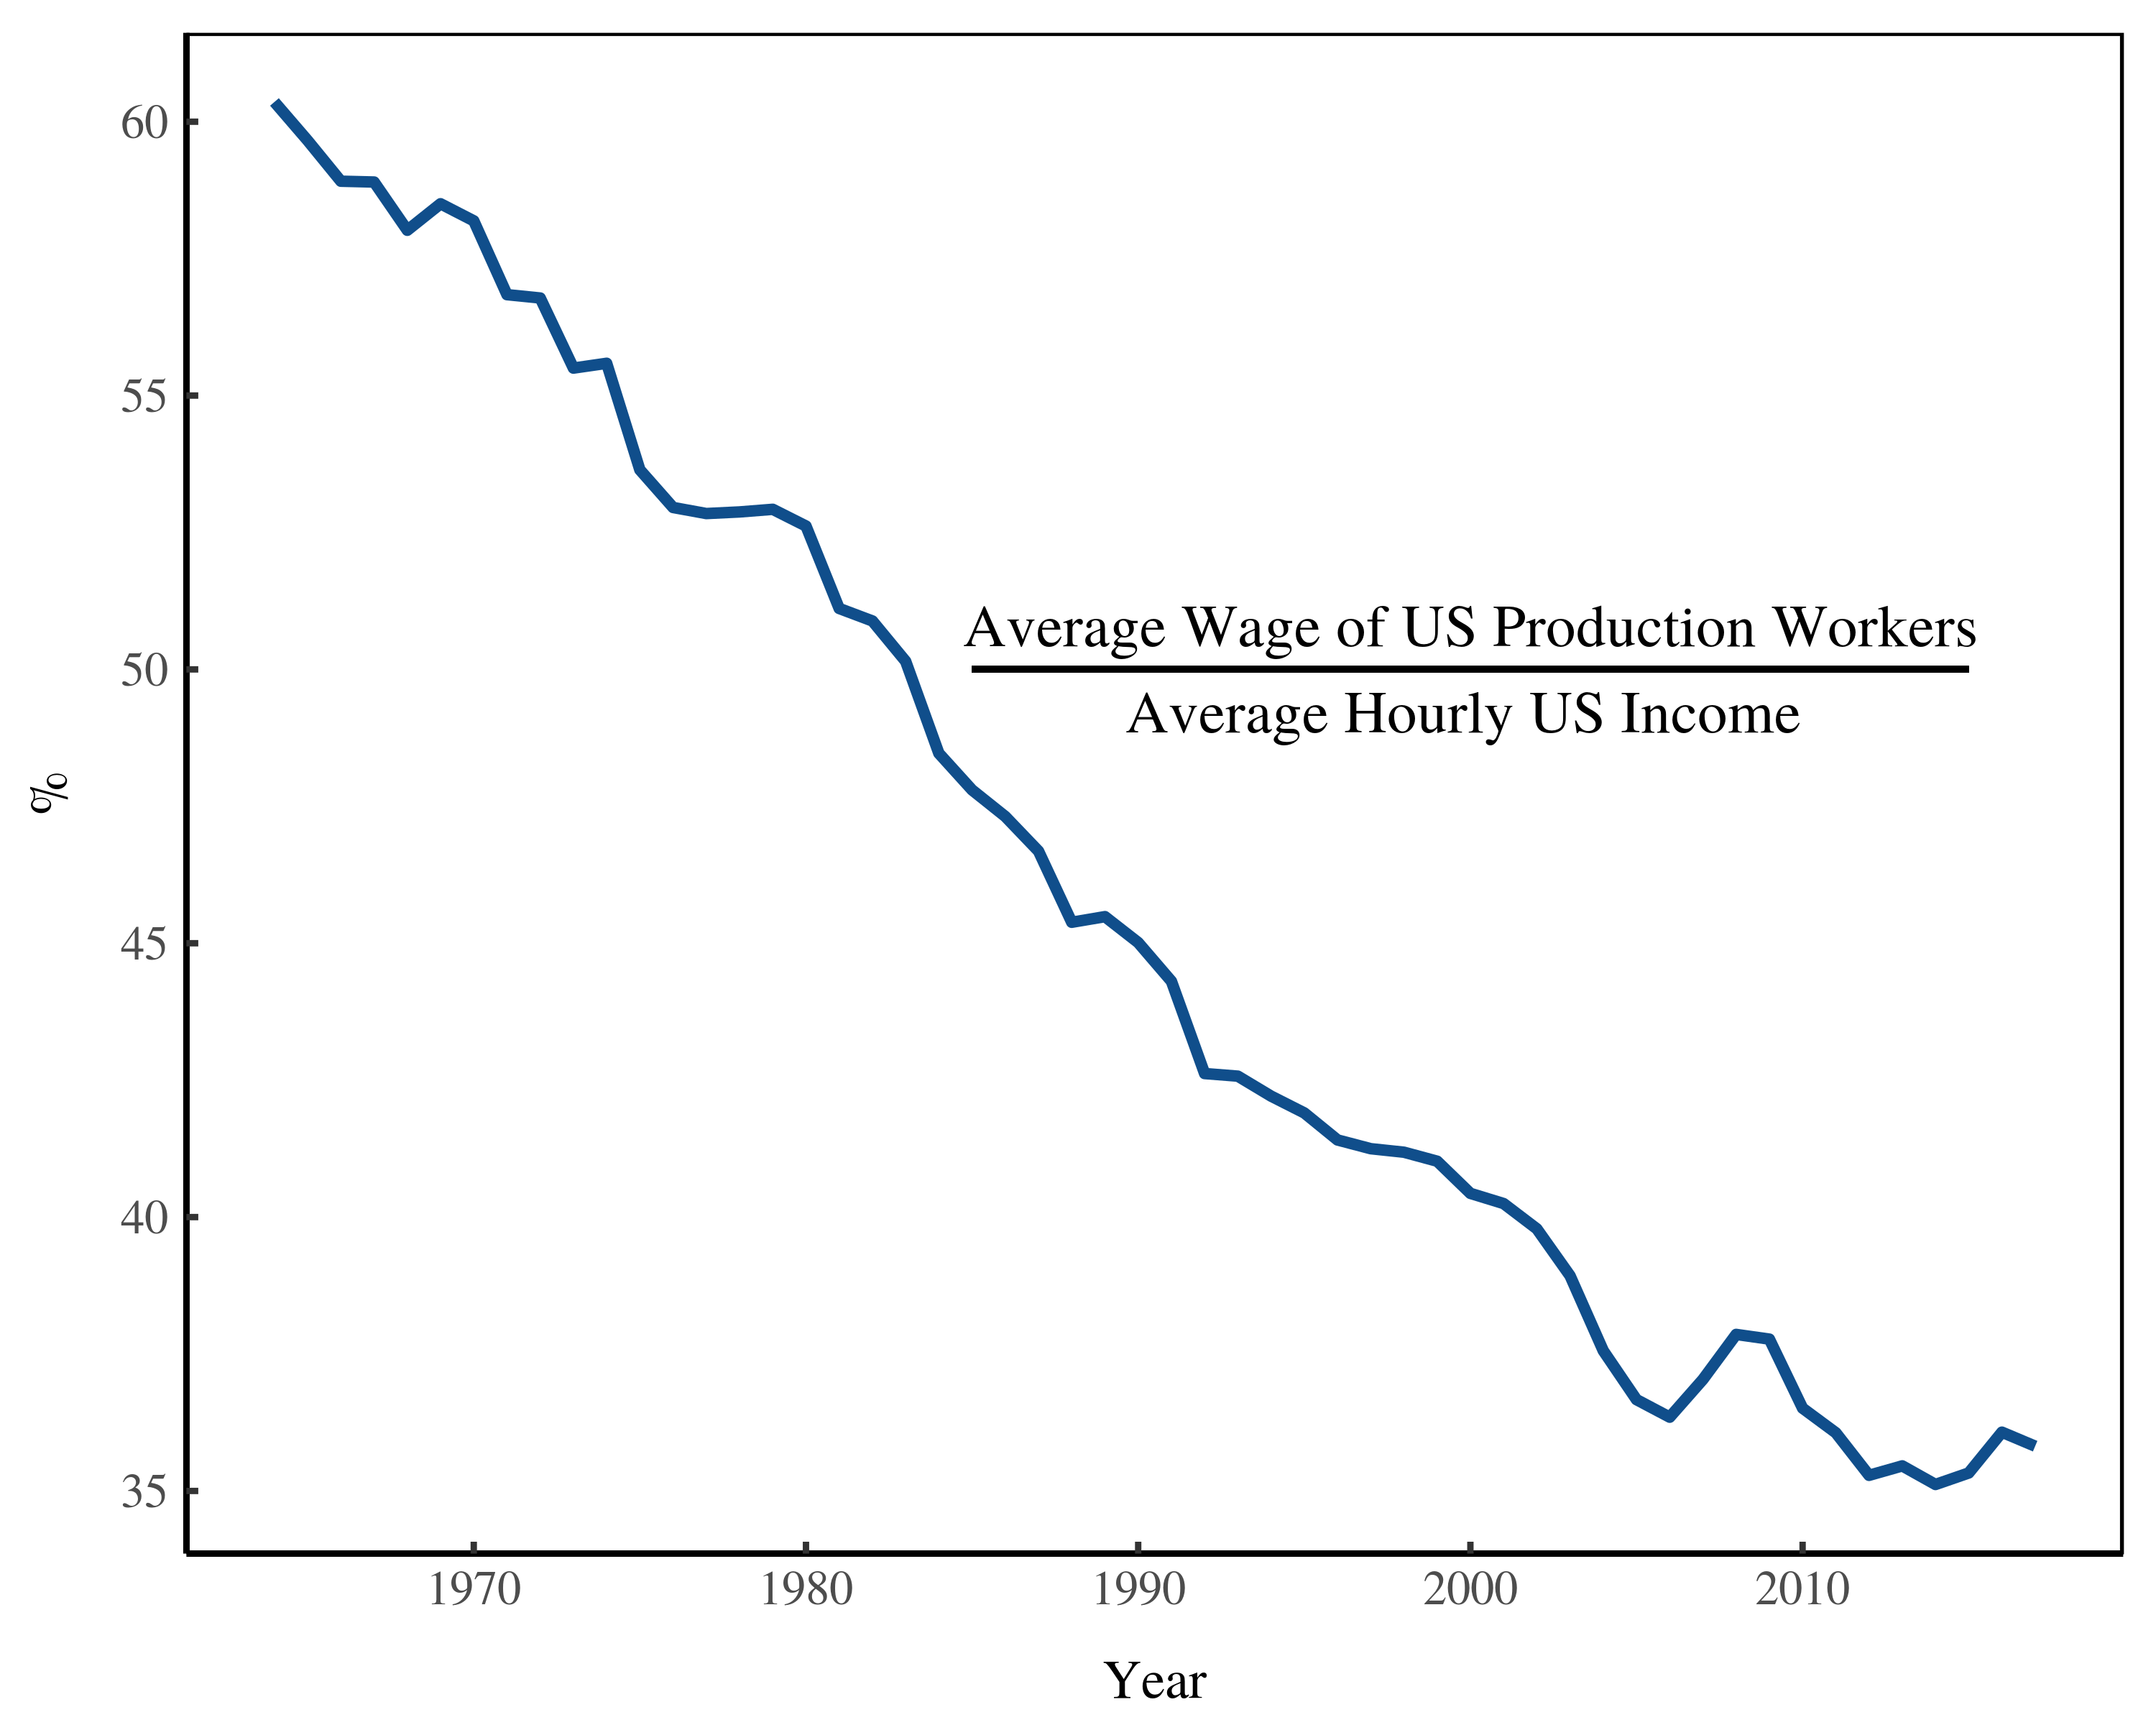
But even if we accept EPI’s inclusion of anything and everything, they still see a big gap, regardless of how you feel about a discounted hamburger. A third of that gap is due to IPD vs CPI. 50-60% (depending on where you bin capital depreciation) is due to pay inequality. And that’s the real story IMO. There’s no need to throw productivity into the mix. It’s a red herring that causes problems while solving little. Better to compare income to income, as one of the articles I linked to above does, e.g. here:

Or median vs mean income, which have diverged but I don’t have a plot handy.

This way there’s no need to justify dueling deflators or counting one group’s productivity but not their income.

In summary, I think we can make our point using less assailable data than that EPI plot.

Eta although if people aren’t knowledgeable/clever enough to assail the EPI plot, I suppose it doesn’t matter much.

Translation: Argle bargle I have no logical response to a critique of my position, so I will resort to insults.

Vehemently opposed to the regulations, but eager to take credit for the good results.

While shifting blame for bad results.