If you listed the issues in order, it’d go like this:
- Concentration of Democrats into small urban spaces
- Racial gerrymandering
- Political gerrymandering
If you listed the issues in order, it’d go like this:
Like I said, I’ve actually made this argument so many times I question why I’d keep making it. Liberals like the narrative that the GOP stole the house via gerrymandering because it appeals to their sense of outrage and “conservative rigging of the electoral system.”
I’ll just repeat the same argument I’ve made before:
I understood that perfectly, and agree. I was trying to expand the discussion beyond that simple point.
…
Look at the the 6th, 7th, and 16th. The 6th and 7th were very carefully drawn in a way that has resulted in two Republican congressmen, and even there they had to shoehorn Reading into the more conservative 16th to make that happen.
If you took the area represented by those three districts and chopped it more naturally into three equal population areas east, northwest, and southwest, east would go democratic.
In total those three districts went 62% GOP.
If I am understanding your claim you are saying that most of the 38% of that larger area live in the eastern section mostly contained in the 6th (which also then has a section that heads west in its north bit, like FL panhandle, but avoiding Reading) and without the gerrymandering that panhandle sans Reading onto the 6th, the 6th would be Democratic with the other two even more very solidly red. Is that correct?
And I can that is likely true.
So one House seat in PA in 2014 went Red as a consequence of gerrymandering. And that seems to be it. One out of 18? A real factor but not the main structural advantage.
And the way those districts voted is not written in stone.
In the post I was responding to you claimed, “Didn’t matter what shapes they were they still all went red and would have if you had cut them into squares instead.” Now you seem to be agreeing that this is not the case. Or at least that it looks likely that this is not the case.
I’m not claiming that gerrymandering is the only reason that the Republicans control the house. I’m refuting claims that it doesn’t have any effect at all. A single counterexample is insufficient to prove the first point, but is enough to show the second.
Who claimed that?
Darrell Issa could be going down!
Please, Calidopers, we *need *this.
I quoted the exact words of the claim I’m refuting. Perhaps the paraphrase you quoted isn’t up to your standards. I feel like it captured the essence of what he was getting at.
There are two main gerrymandering techniques. Packing and cracking. Packing is trying to put as many of your opponents as densely into as few as districts as possible. Some packing may be unavoidable due to Democrats tendency to live in higher population density areas.
Cracking is splitting up areas where your opponents are concentrated into multiple districts. The way the lines are drawn for the 6th, 7th, and 16th districts in PA are a pretty clear example of cracking. Areas near west Philly and Reading were carefully split into three separate districts.
This is just one example. Gerrymandering does not account for enough of a difference to flip the house today, but it may make all the difference come November.
That would be so sweet! I loathe that smarmy bastard.
No, you really completely missed the essence of what I was getting at.
I had indeed stated that in those particular districts it wouldn’t have mattered if they were cut into squares and did indeed concede that perhaps a cut creating an eastern third and dividing the western two thirds into a northern and southern portions could, if your claim that the eastern third, and Reading, are where all the relatively few Democrats of those three House districts are concentrated, would have possibly created an additional Democratic district.
That was not the major point (or essence) of what I was getting at, but I did concede that it was possible that I was incorrect in my statement.
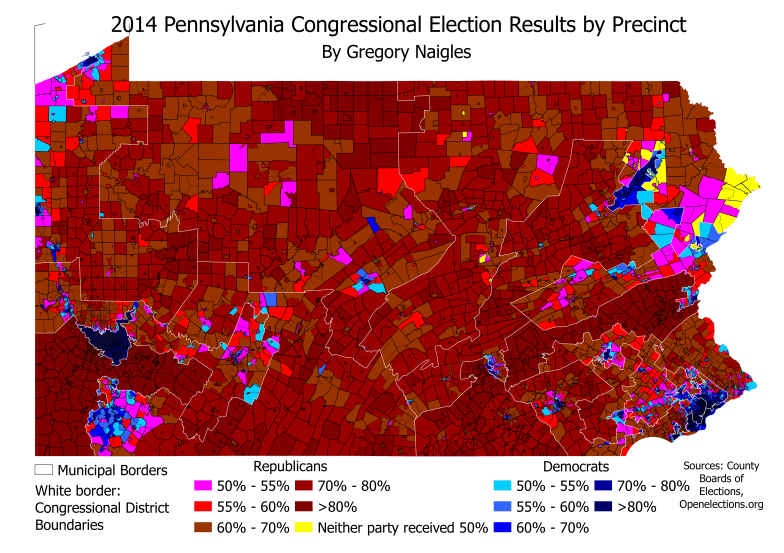
And I was mistaken to have done so. See here,, particularly this map of results by individual precinct in 2014. That eastern section? Also a sea of red leaning. A few flecks of blue maybe but no, an eastern rectangle would also have elected a GOP representative.
In the case of PA’s 2014 election it appears that my initial position, “the essence of what I was getting at”, that gerrymandering had a nonzero, nontrivial, but not major impact in comparison to other structural factors was understated: it had no impact on the outcome for PA House seats in 2014. I stand by the position that it did have some nontrivial impact nationally however.
The linked map illustrates the more major structural factor: Democrats are huge overwhelming majorities in the few heavily populated metropolitan centers and moderate minorities in the rest of the state.
Winning the cities by even larger margins and higher turnouts while rural districts have fairly low turnout and narrowed GOP margins is a reasonable path to winning the state for the presidency and maybe for Senate … it will get a majority of state voters voting a Democratic House representatives … but it is not the path to getting any more Democratic House representatives. In PA at least you need to be able to sell more rural voters on the Democratic House challenger running in their rural districts to win a majority of PA’s House seats.
More on exactly how big of a lift winning the House could be from Cook’s ratings as of July 22, before conventions and the current Trump crater.
Start out with safe seats: 202 Rep, 177 Dem. 218 is majority.
26 are toss-ups.
17 are lean, currently more towards R, but are considered competitive. Even if their districts are shaped odd.
So out of 43 competitive races the Democrats would need to win 41 or more to take the majority.
A heckuva big lift but an overall shift in polls, especially if it comes with a low turnout of some usually reliable traditional GOP voters, can shift the whole bunch the few points over to acheive it. With that hypothetical you’d expect to win the D leaners (6) and the toss-ups en masse (26) which gets to 32 of the 41. It needs to be a serious wave to pull out 9 of 11 currently leaning GOP. But far from impossible if the particular districts divide the GOP.
FWIW Wang’s Meta-margin is now D +2.1% for a 50-50 Senate (which goes D for control with a Clinton-Kaine win) and is relatively persistently in the range of “likely Democratic control” for the House. Again, FWIW.
No 538 tracker yet.
The thing is, in a real wave election some of those safe seats will surprise and be lost. So it’s a bit more complex an equation than it seems at first blush.
Well maybe for certain tautological values of “a real wave” … but not sure how realistic it is. There are sizable structural advantages, only some little bit that is based on GOP gerrymandering, that make that very difficult. Again, the precinct map of PA in 2014’s House election … and the results by district.
You have a few urban centers being won by huge Democratic margins and lots of rural areas. The Trump effect will further accentuate what is already there: bigger D margins in urban centers as urban Whites either move more D or stay home, and the same or slightly better in rural ones as non-college educate especially rural Whites go Trump.
The question I have is how many districts across the country, generally thought of as safe Red, are mostly suburban? If many then we can really see a wave. Do you know?
According to this article Priebus told Trump last week that if he didn’t change his campaign, the Party would shift its attention to down-ticket races.
I particularly like this:
Trump, I’m sure you will not be shocked to hear, claims that the conversation never took place.
I wonder if Priebus will listen to this letter then:
I wonder how many of those Republicans are among the 50 that spoke out earlier this week, and how many are new faces.
Wang’s written more on the subject today and his updated graph is interesting. He no longer asserts a clear correlation but instead discusses how
He also notes that district by district analysis is far superior to that broad association method but is slow to update.
So per Wang, and I believe him on this, the impact of gerrymandering per se is maybe a dozen or more seats and the association of the popular vote for the House and the results is loose and looser as a result of that gerrymandering. Note that in 2012 and 2014 a dozen seats or so would not have made the difference in which party had control. The margin of the popular vote result that would lead to a change in control is a best guess: he uses 4.5% to offset the whole group of structural advantages but notes others estimate up 10% as well.
Sorry for the multiple posts but this article also informs about the structural advantages well beyond gerrymandering.
More detail from the article most pertinent is that there are 88 districts with low diversity but high education. Currently the GOP controls 49 of them. These are mostly if not exclusively the suburban districts that the Trump effect will have the biggest impact in.
The effect will be less in (mostly rural) districts low both in diversity and white education levels and ramping up the margins in high diversity (mostly urban) districts won’t change the House numbers at all.